
Thanks
Exactly what i was looking for ☺
//Fredrik Winäs tel +46 31 762 02 43
From: observium [mailto:observium-bounces@observium.org] On Behalf Of Markus Klock Sent: den 8 juli 2016 15:13 To: Observium Network Observation System observium@observium.org Subject: Re: [Observium] Make a custom aggregate graph
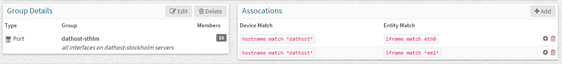
Hi Fredrik, you can do this by creating a portgroup Here is mine that match all servers with a hostname that contains dathost with interfaces called either eth0 or em1 when you have all the ports you are interested in the same group you can then have Observium draw an aggregate graph of all the selected ports. Hope this helps! [Infogad bild 1]
2016-07-08 15:02 GMT+02:00 Fredrik Winäs <Fredrik.Winas@cgit.semailto:Fredrik.Winas@cgit.se>: Hi
The Graph that is on the Overview page with all ports combined, can I do my own?
I have dualhomed servers (vmware hosts) and I would like to have a graph with all switch ports that is used. Most of those servers are connected to more than one switch .
Med Vänlig Hälsning
Fredrik Winäs tel +46 31 762 02 43tel:%2B46%2031%C2%A0762%2002%2043 fredrik.winas@cgit.semailto:fredrik.winas@cgit.se www.cgit.sehttp://www.cgit.se/ CGit AB Taljegårdsgatan 11C SE-431 53 Mölndal
_______________________________________________ observium mailing list observium@observium.orgmailto:observium@observium.org http://postman.memetic.org/cgi-bin/mailman/listinfo/observium