
1 Dec
2016
1 Dec
'16
5:40 p.m.
Hi,
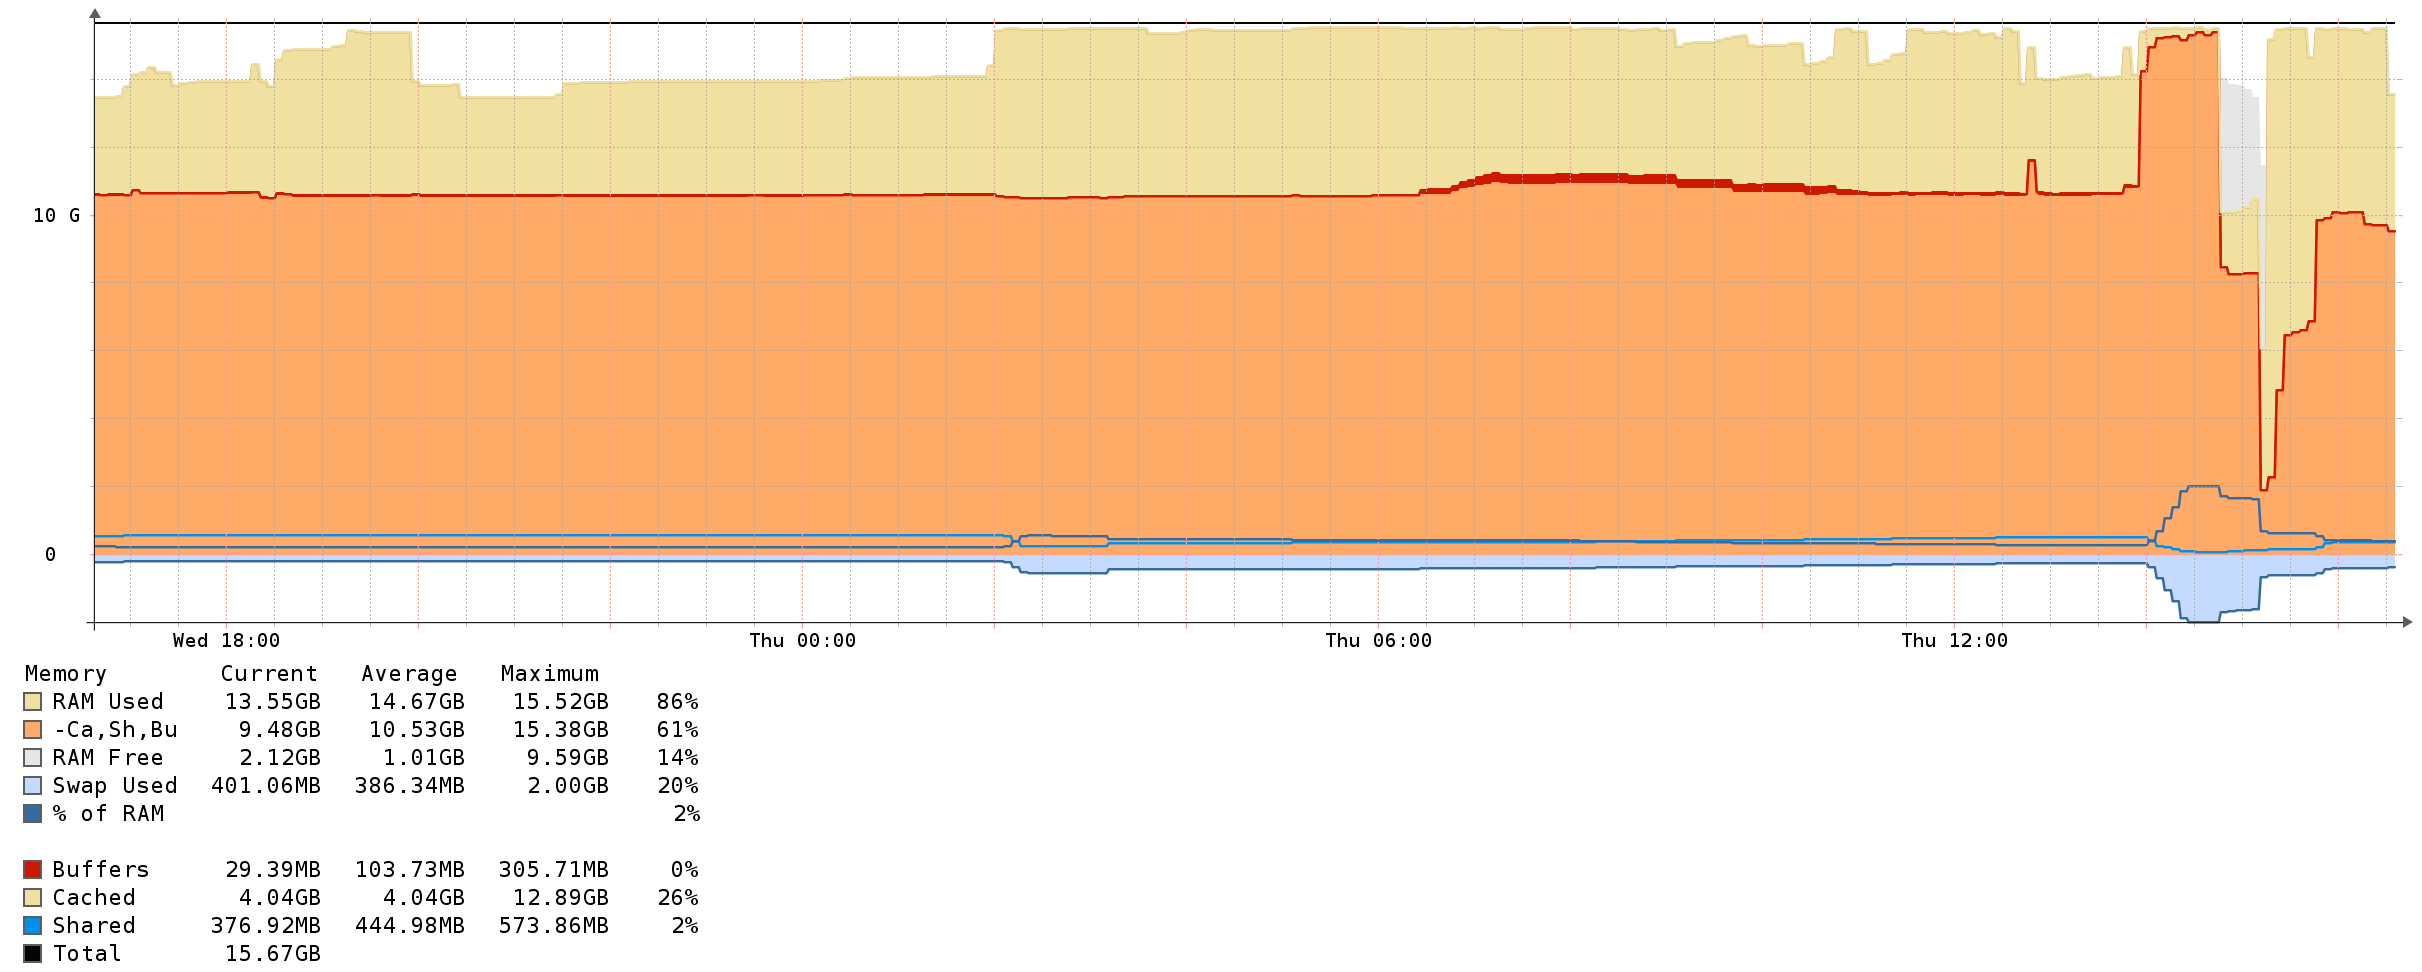
I have an alert on a linux server configured for "mempool_perc gt 90", which is firing all the time because of irrelevant caching use. Memory on Linux is always used. I'm more interested in the orange part of this graph:
The device is called ucd_memory. Is there a metric I can use to get the value that's at 61% in this graph, to catch spikes like the one at 14:00 time?
Thanks Maik