
5 Apr
2018
5 Apr
'18
1:45 p.m.
Hello,
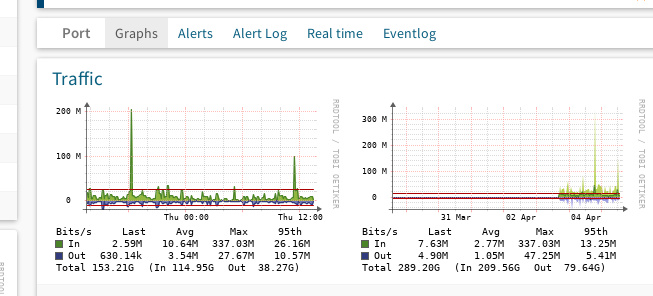
Here's a screenshot of 2 Traffic graphs for a 10G port on a Cisco 6509. The second (week) graph seems accurate, with the spike indicating a little over 300M bits/s. The first (day) graph indicates that the same spike is only 200M bits/s. The actual numbers under the graphs agree that the max is 337.03M.
Traffic
Why doesn't the first graph show the actual value?
This is on v 18.3.9125.
Thanks,
--
Richard Kuhns rjk@wintek.com
Wintek Corporation
427 N 6th Street
Lafayette, IN 47901-2211
Main: 765-742-8428
Direct: 765-269-8541