
Hi,
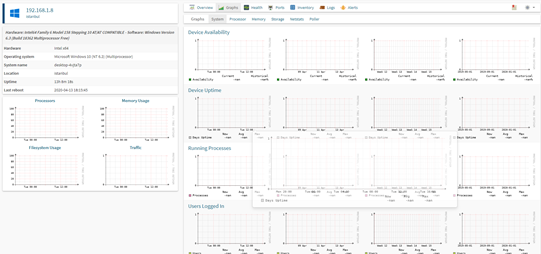
If the graph images themselves are drawing, this means that RRDs exist, which means the device in question has been polled once.
If the graphs have no data being drawn, this means they’ve not completed at least 2 polls 5 minutes apart.
This is likely either :
Permissions issue preventing the user the poller runs as from writing to the RRDs
The poller isn’t being run correctly from cron
Did you use the install script? If so this is running the poller as the Observium user. If you run the poller as root the first time, it’ll create RRDs that the poller user can’t write to.
If the poller (poller-wrapper.py) isn’t running properly, it can be a number of things. The most common cause used to be that people put the wrong cron line format in the wrong file, because they didn’t follow the instructions quite closely enough.
Adam.
From: observium [mailto:observium-bounces@observium.org] On Behalf Of Remzi BASOGLU via observium Sent: 14 April 2020 16:16 To: observium@observium.org Cc: Remzi BAŞOĞLU remzi.basoglu1@gmail.com Subject: [Observium] Graphs Problem
Hi,
I installed Observium and added a few machines. I can see details (RAM, disk etc) but the graphs doesnt show anything. What should I do ?
Thanks.