
Under Host -> Graphs -> System I see Running Processes counts which might be what you are looking for? (along with lots of other things)
Otherwise Collectd can do 'stats' on process by name, or a 'regex' process group (ie qty of process with name matching, summed data etc..)
https://collectd.org/wiki/index.php/Plugin:Processes
The collectd stuff under Observium is pretty simple, setting up the collectd can be a bit more complex, but gives some really nice host based things
http://www.observium.org/wiki/Collectd_Integration
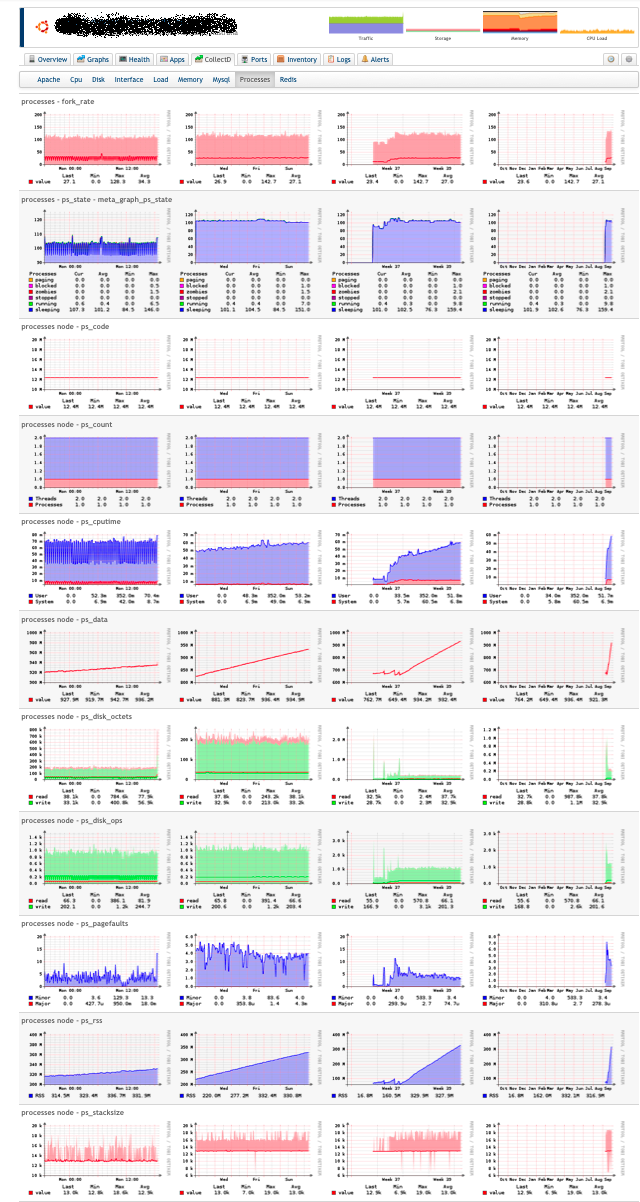
Attached a picture of a device where I am watching process 'node' (ie a nodejs daemon...)
On 30/09/13 6:12 PM, "Mihai Tanasescu" mihai@duras.ro wrote:
Hello,
I'm a newbie with Observium having just installed it, but now a question has popped up in my head that I could not find a clear answer to by googling. I have a couple of Linux hosts for which I also added in the net-snmpd conf a counter for the number of imapd & others processes. How could I add to a small part of the existing graphed servers, this OID ? (or where should I look in the conf ?) I was thinking maybe defining a new template (if this is the working principle) and adding there these OIDs also for the discovery phase.
Can someone advise me at least where to start my question with ? I'm a bit confused at the moment.
Thanks, Mihai _______________________________________________ observium mailing list observium@observium.org http://postman.memetic.org/cgi-bin/mailman/listinfo/observium