
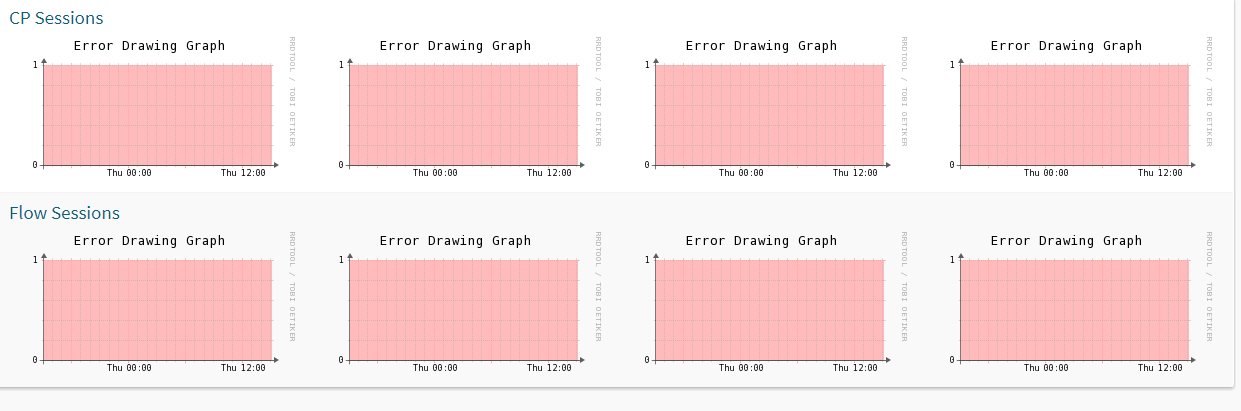
Hi, I have an issue with a SRX340 device running 15.1X49-D90 and it seems to poll sessions from the device but Observium is unable to graph and draw the graphs? Looks like this. [cid:image001.png@01D2FBE9.A484BD00] __________________________________________________
Any debugging I can do to find out? I did a poller -dd and it looks like this:
less /var/tmp/fw5.log | egrep -i session
SQL[SELECT @@SESSION.sql_mode;] SQL[SELECT @@SESSION.sql_mode;] jnxJsSPUMonitoringCurrentFlowSession.0 = 184 jnxJsSPUMonitoringMaxFlowSession.0 = 262144 jnxJsSPUMonitoringCurrentCPSession.0 = 0 jnxJsSPUMonitoringMaxCPSession.0 = 0 [jnxJsSPUMonitoringCurrentFlowSession] => string(3) "184" [jnxJsSPUMonitoringMaxFlowSession] => string(6) "262144" [jnxJsSPUMonitoringCurrentCPSession] => string(1) "0" [jnxJsSPUMonitoringMaxCPSession] => string(1) "0" ds[CurrentFlowSession].index = 0 ds[CurrentFlowSession].type = "GAUGE" ds[CurrentFlowSession].minimal_heartbeat = 600 ds[CurrentFlowSession].min = 0.0000000000e+00 ds[CurrentFlowSession].max = 1.0000000000e+11 ds[CurrentFlowSession].last_ds = "195" ds[CurrentFlowSession].value = 1.1503313835e+04 ds[CurrentFlowSession].unknown_sec = 0 ds[MaxFlowSession].index = 1 ds[MaxFlowSession].type = "GAUGE" ds[MaxFlowSession].minimal_heartbeat = 600 ds[MaxFlowSession].min = 0.0000000000e+00 ds[MaxFlowSession].max = 1.0000000000e+11 ds[MaxFlowSession].last_ds = "262144" ds[MaxFlowSession].value = 1.5464229241e+07 ds[MaxFlowSession].unknown_sec = 0 ds[CurrentCPSession].index = 2 ds[CurrentCPSession].type = "GAUGE" ds[CurrentCPSession].minimal_heartbeat = 600 ds[CurrentCPSession].min = 0.0000000000e+00 ds[CurrentCPSession].max = 1.0000000000e+11 ds[CurrentCPSession].last_ds = "0" ds[CurrentCPSession].value = 0.0000000000e+00 ds[CurrentCPSession].unknown_sec = 0 ds[MaxCPSession].index = 3 ds[MaxCPSession].type = "GAUGE" ds[MaxCPSession].minimal_heartbeat = 600 ds[MaxCPSession].min = 0.0000000000e+00 ds[MaxCPSession].max = 1.0000000000e+11 ds[MaxCPSession].last_ds = "0" ds[MaxCPSession].value = 0.0000000000e+00 ds[MaxCPSession].unknown_sec = 0 'CurrentFlowSession' => array('label' => 'CurrentFlowSession'), 'MaxFlowSession' => array('label' => 'MaxFlowSession'), 'CurrentCPSession' => array('label' => 'CurrentCPSession'), 'MaxCPSession' => array('label' => 'MaxCPSession'), fdb_count,jnxJsSPUMonitoringFlowSessions, jnxJsSPUMonitoringCPSessions, poller_perf
It seems Observium is getting the value from the device?
Regards
-John