
Hi, I don't think those two graphs show the same interface in the router, all the data is different. Can you show a full screenshot of the whole page for both Observium and Cacti? /Markus
2017-02-07 8:43 GMT+01:00 Sophanith Chhom sophanith.chhom@gmail.com:
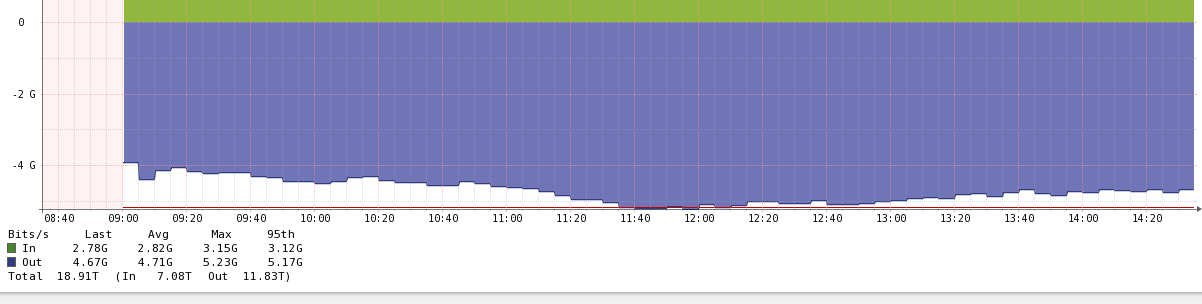
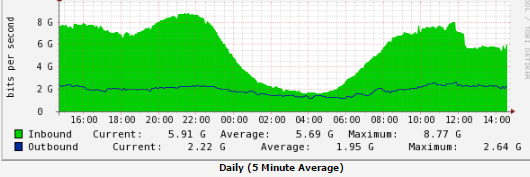
I have looked on some specific interface and found out that it's all different, bellow is the comparison of the same traffic:
[image: Inline image 1]
[image: Inline image 2]
See? current Inbound traffic on Cacti is 5.91GB vs Observium 4.67GB (last)
Thanks
On Tue, Feb 7, 2017 at 2:33 PM, Markus Klock markus@best-practice.se wrote:
Hi, which graph are you looking at? an overview graph or on a specific interface? what time interval are you looking at? 6h, 24h, 1 week? Can you show us a comparison of the same traffic in cacti?
/Markus
2017-02-07 8:09 GMT+01:00 Sophanith Chhom sophanith.chhom@gmail.com:
Dear Team,
I just install Observium and as I observed the graph traffic statistic seem not accurate compared to my Cacti graph monitoring system then I ask my Network Engineer to check which one is accurate traffic between Observium and Cacti, as the result after checking real traffic on my router device, Observium seems not accurate.
Note: Graph statistic value is different is around 1GB, this is a huge number.
Can anyone explain why or anyone experiences like me?
[image: Inline image 1]
My real Out traffic should be around 5.78GB instead
Thanks so much.
observium mailing list observium@observium.org http://postman.memetic.org/cgi-bin/mailman/listinfo/observium
observium mailing list observium@observium.org http://postman.memetic.org/cgi-bin/mailman/listinfo/observium
observium mailing list observium@observium.org http://postman.memetic.org/cgi-bin/mailman/listinfo/observium