
Specify the sensor_type in the group association.
Adam.
Sent with AquaMail for Android http://www.aqua-mail.com
On 23 September 2015 23:12:28 Andrew Plas andrewp.plas@gmail.com wrote:
Any thoughts on this matter? Is this straightforward to add, or should I be talking to some dev guys for a custom page that grabs Observium's mysql data? ...would I be better off looking to a proper DCIM?
As always, thank you for the input!
On Fri, Aug 28, 2015 at 3:03 PM, Andrew Plas andrewp.plas@gmail.com wrote:
Would it be possible to add a Total Graph for specific Heath statistics, similar to how the total graphs are displayed for Peering, Transit, and Core port types?
What I am interested in is essentially adding values already collected by Observium from a handful of devices (rack PDU's) to determine the combined Current in amps and Power in watts to graph and track power consumption across an entire row or even datacenter. We can see this information per-rack from the PDU device already added to Observium, but for our datacenter managers it would be useful to track power consumption across the whole room or suite. In several of our POPs power is provided so we cannot poll the UPS itself- only our own rack PDUs connected to the facility's power bus. Even then, most have A and B side power so we have two PDUs per rack.
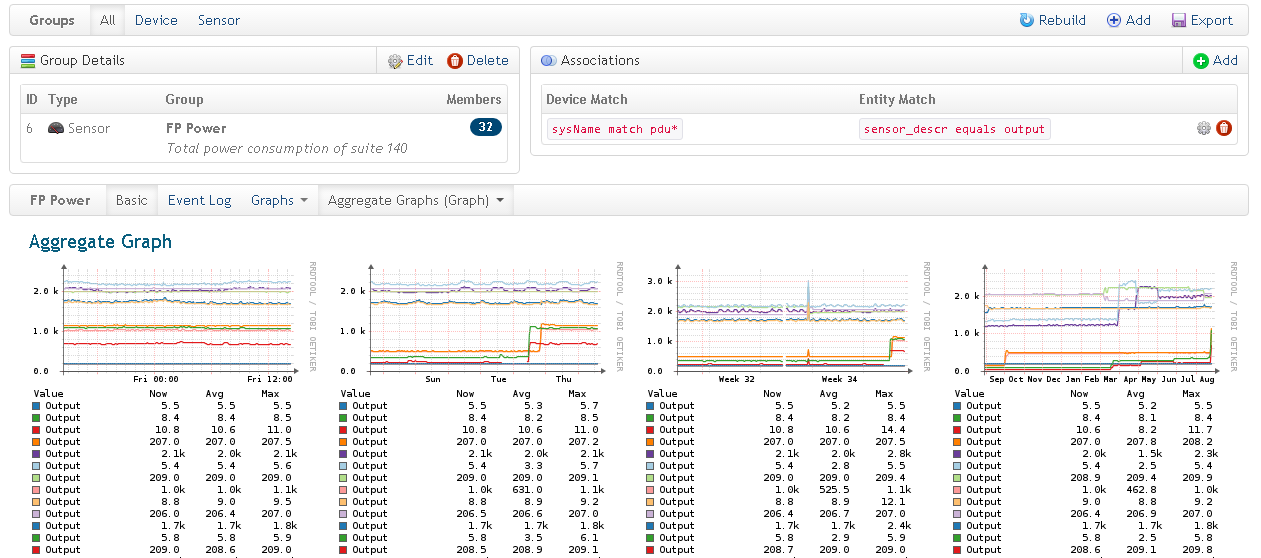
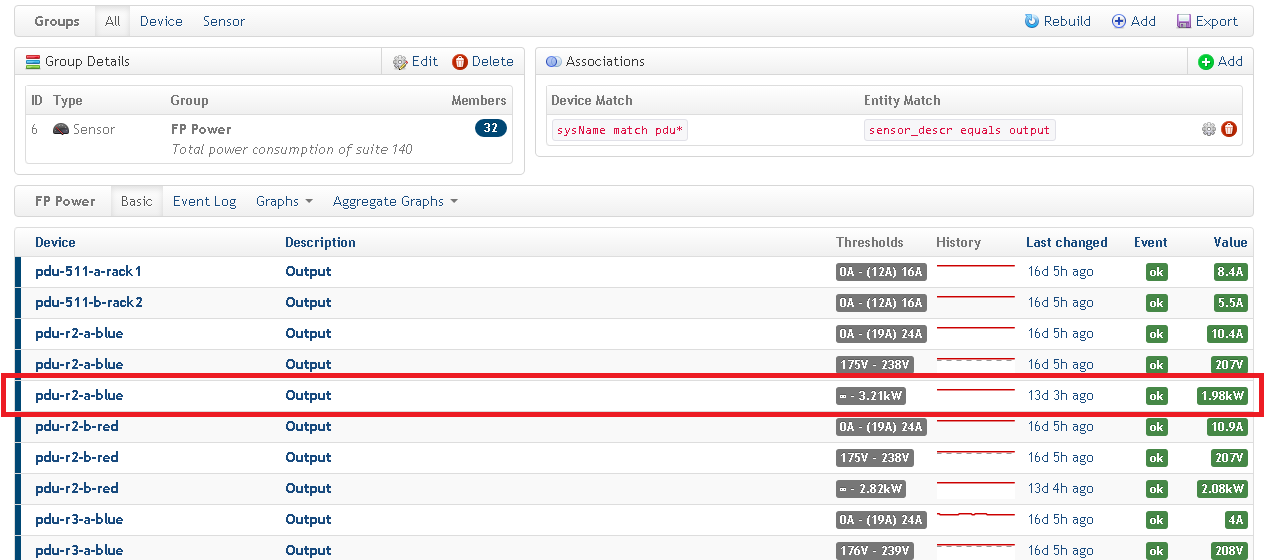
To the end, I have created a device group by sensor sorting "pdu" device names and filtering for their output values. However, the built-in aggregate graphs show each device's data on one graph and doesn't combine them for a total. Further, my filter seems to pull many values labeled "Output" including voltage and amperage as well as wattage. Any suggestions to refine my filter to get one group for Amps and another for Watts? Please see the screenshots below.
Most PDU's are APC model AP8941.
I admit this would really only be useful for the "Power" and "Current" health monitors, as items like voltage and temperature are really only useful per-device. Even then, these total graphs would have the most value being filtered to a specific set of devices and likely by location. Maybe a total graph display under /groups may be more useful than one under /health/metric=power or /health/metric=current?
Thank you!
https://observium/group/group_id=6/
https://observium/group/group_id=6/view=basic/agg_graph=graph/
observium mailing list observium@observium.org http://postman.memetic.org/cgi-bin/mailman/listinfo/observium