
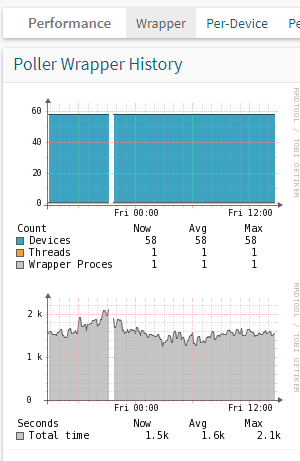
Hi Justin, The poller needs to finish polling all your devices in 5min(300s) and your system takes 1600s to finish one pollinground. This is because you only run the poller-wrapper with 1 thread, you should run as many threads as twice the amount of CPU-cores on this VM. Try increasing them and wait 10min and then check the poller-wrapper Total time-graph again.
/Markus
Den fre 3 jan. 2020 kl 23:48 skrev Justin Radke via observium < observium@observium.org>:
I hope the graphs show up below, thanks for your help:
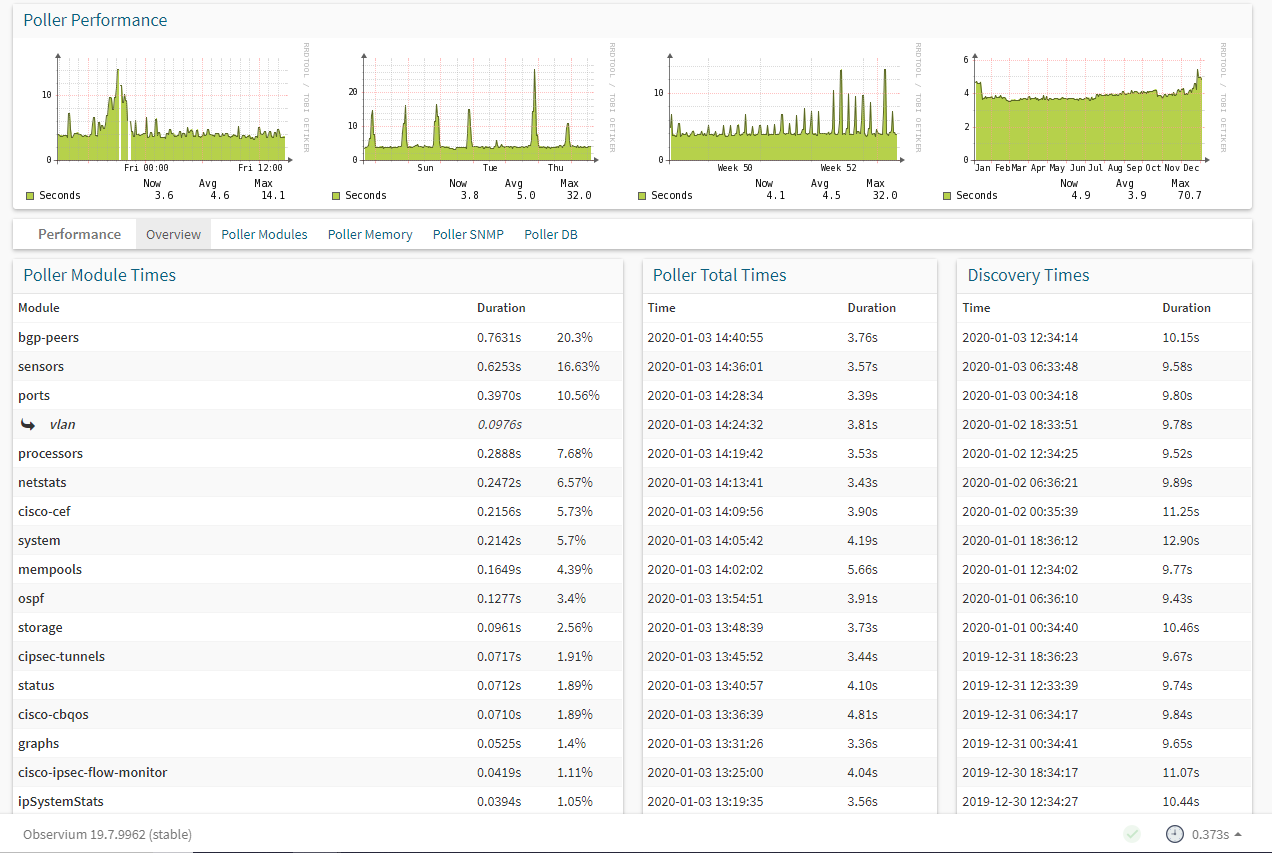
Please provide a screenshot of the "Polling information"-page.
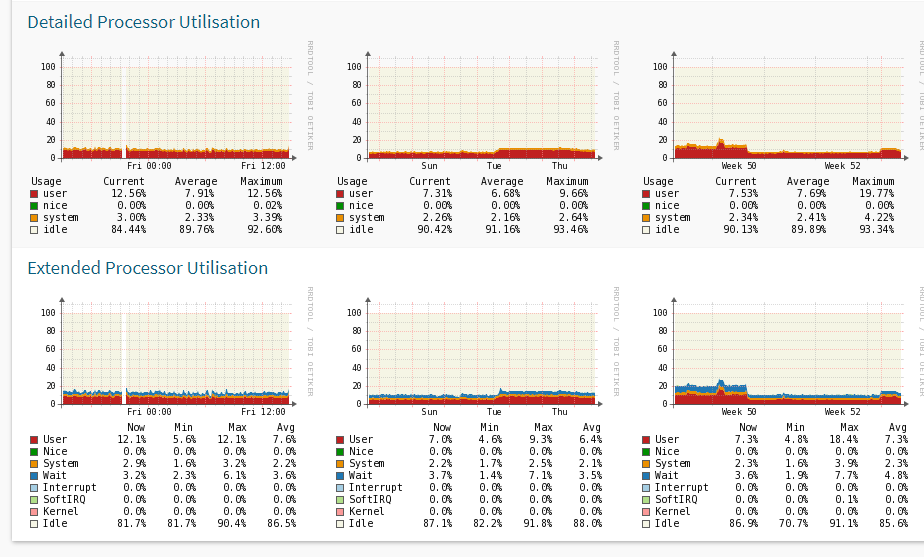
And if you monitor the Observium-VM itself with Observium then go to that device, Graphs>Processor>Extended Processor Utilisation and screenshot that graph too please
/Markus
-----Original Message----- From: observium observium-bounces@observium.org On Behalf Of observium-request@observium.org Sent: Friday, January 3, 2020 4:00 AM To: observium@observium.org Subject: observium Digest, Vol 114, Issue 2
Send observium mailing list submissions to
observium@observium.orgTo subscribe or unsubscribe via the World Wide Web, visit
http://postman.memetic.org/cgi-bin/mailman/listinfo/observium
or, via email, send a message with subject or body 'help' to
observium-request@observium.orgYou can reach the person managing the list at
observium-owner@observium.orgWhen replying, please edit your Subject line so it is more specific than "Re: Contents of observium digest..."
Today's Topics:
Gaps in Graphs (Justin Radke)
Re: Gaps in Graphs (Michael)
Re: Gaps in Graphs (Justin Radke)
Re: Gaps in Graphs (Markus Klock)
Message: 1
Date: Thu, 2 Jan 2020 20:29:29 +0000
From: Justin Radke justin.radke@directlink.coop
To: "observium@observium.org" observium@observium.org
Subject: [Observium] Gaps in Graphs
Message-ID:
<MWHPR06MB3374668112EE9110EE59D63782200@MWHPR06MB3374.namprd06.prod.outlook.com
Content-Type: text/plain; charset="utf-8"
Hello, periodically I have "gaps" in my graphs which appears to be when Observium was unable to reach a particular host. This problem occurs on multiple hosts at the same time on different network segments and I have been unable to find any commonality except for the Observium server itself. I noticed that the gaps in the graph also exist at the same times for Observium's checks of localhost. Checking localhost of course demonstrates this is not a lack of network connectivity outside of the server.
At these times I also found these entries but I'm not sure if they are related since they are merely syslog messages but thought I'd mention it:
Jan 1 21:39:24 voldemort rsyslogd-2177: imuxsock begins to drop messages from pid 27161 due to rate-limiting Jan 1 21:45:50 voldemort rsyslogd-2177: imuxsock lost 22 messages from pid 27161 due to rate-limiting
root@observium(~)
:ps auxw | grep 27161
root 27161 0.0 0.0 200848 6520 ? S 2019 15:32 /usr/sbin/snmpd -LS0-6d -Lf /dev/null -p /var/run/snmpd.pid
What would cause this and how can I solve this matter?
-=JGR