
rrdtool works in mysterious ways.
the 24 hour graph probably isn't showing 5 minute resolution of the data (and doesn't show the "max" shadow because it's ugly).
adam.
------ Original Message ------ From: "Richard Kuhns" rjk@wintek.com To: observium@observium.org Sent: 2018-04-05 18:45:09 Subject: [Observium] A graph that doesn't quite match the data
Hello,
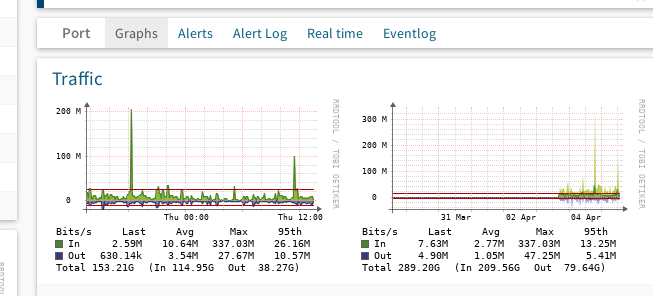
Here's a screenshot of 2 Traffic graphs for a 10G port on a Cisco 6509. The second (week) graph seems accurate, with the spike indicating a little over 300M bits/s. The first (day) graph indicates that the same spike is only 200M bits/s. The actual numbers under the graphs agree that the max is 337.03M.
Why doesn't the first graph show the actual value?
This is on v 18.3.9125.
Thanks,
-- Richard Kuhns rjk@wintek.com mailto:rjk@wintek.com Wintek Corporation 427 N 6th Street Lafayette, IN 47901-2211
Main: 765-742-8428 Direct: 765-269-8541