
Hello!
I have a few Mikrotik RB750r2, polled by SNMPv3, and I can't have graphs working in Observium.
In those routers, I get ethernet interface oids with "/interface print oid"
[...] 0 R name=.1.3.6.1.2.1.2.2.1.2.1 actual-mtu=.1.3.6.1.2.1.2.2.1.4.1 mac-address=.1.3.6.1.2.1.2.2.1.6.1 admin-status=.1.3.6.1.2.1.2.2.1.7.1 oper-status=.1.3.6.1.2.1.2.2.1.8.1 *bytes-in=.1.3.6.1.2.1.31.1.1.1.6.1* packets-in=.1.3.6.1.2.1.31.1.1.1.7.1 discards-in=.1.3.6.1.2.1.2.2.1.13.1 errors-in=.1.3.6.1.2.1.2.2.1.14.1 *bytes-out=.1.3.6.1.2.1.31.1.1.1.10.1* packets-out=.1.3.6.1.2.1.31.1.1.1.11.1 discards-out=.1.3.6.1.2.1.2.2.1.19.1 errors-out=.1.3.6.1.2.1.2.2.1.20.
[...]
and with "snmpwalk -v3 -u user -l authpriv -a SHA -A pass1 -x AES -X pass2 <ipdev> " y can get the values for each oid, specifically:
iso.3.6.1.2.1.31.1.1.1.6.1 = Counter64: 604689902 ...
iso.3.6.1.2.1.31.1.1.1.10.1 = Counter64: 116701642
I added the device with
/opt/obserivium/add_device.php <ipdev> ap v3 user pass1 pass2 sha aes
without errors, and discovery and poller processes ends without errors:
+---------+-----------+----------+---------+----------+----------+---------+----------+--------+---------+----+ | ifIndex | Label | Type | Speed | BPS In | BPS Out | Data In | Data Out | PPS In | PPS Out | HC | +---------+-----------+----------+---------+----------+----------+---------+----------+--------+---------+----+ | 1 | Ether1 | Ethernet | 100Mbps | 232kbps | 192kbps | 1.22MB | 1.01MB | 66.4 | 77.7 | Y | | 2 | Ether2 | Ethernet | 1Gbps | 133kbps | 152kbps | 718kB | 820kB | 87 | 74.3 | Y | | 3 | Ether3 | Ethernet | 0bps | 0bps | 0bps | 0B | 0B | 0 | 0 | Y | | 4 | Ether4 | Ethernet | 0bps | 0bps | 0bps | 0B | 0B | 0 | 0 | Y | | 5 | Ether5 | Ethernet | 0bps | 0bps | 0bps | 0B | 0B | 0 | 0 | Y | | 7 | bridge1 | Bridge | 0bps | 131kbps | 149kbps | 704kB | 805kB | 87.4 | 75.8 | Y | | 8 | ovpn-out1 | Other | 10Mbps | 92.1kbps | 94.1kbps | 495kB | 505kB | 61.7 | 63.6 | Y | +---------+-----------+----------+---------+----------+----------+---------+----------+--------+---------+----+
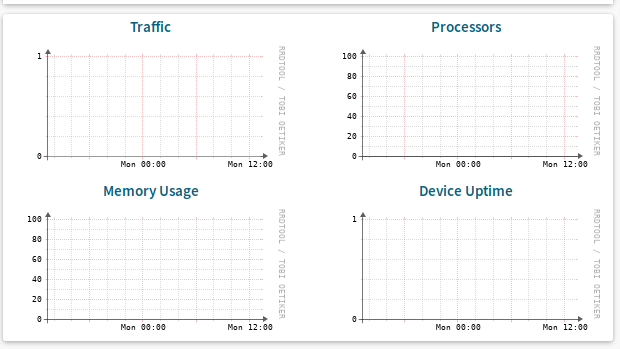
But I can get the graphs for the ports nor the others items.
¿Any suggestions?
Thanks in advance!
-Javier