
Hi,
Seems fine on our install/setup?
Have you tried using the debug in the url and see what the SQL querys show?
Do you have the Cache switched on? As it can take up to 2mins for the cache to clear and show pages correctly
https://observius.cdc.local/ports/state=down/ignore=0/debug https://observius.cdc.local/ports/state=down/ignore=0/debug
Regards
Simon
On 4 Sep 2017, at 15:14, Robert Williams Robert@CustodianDC.com wrote:
Hi all,
I’ve got 12 ports showing as ‘Down’, both on the main page here…
<Picture (Device Independent Bitmap) 1.jpg>
…and on the menu:
<Picture (Device Independent Bitmap) 2.jpg>
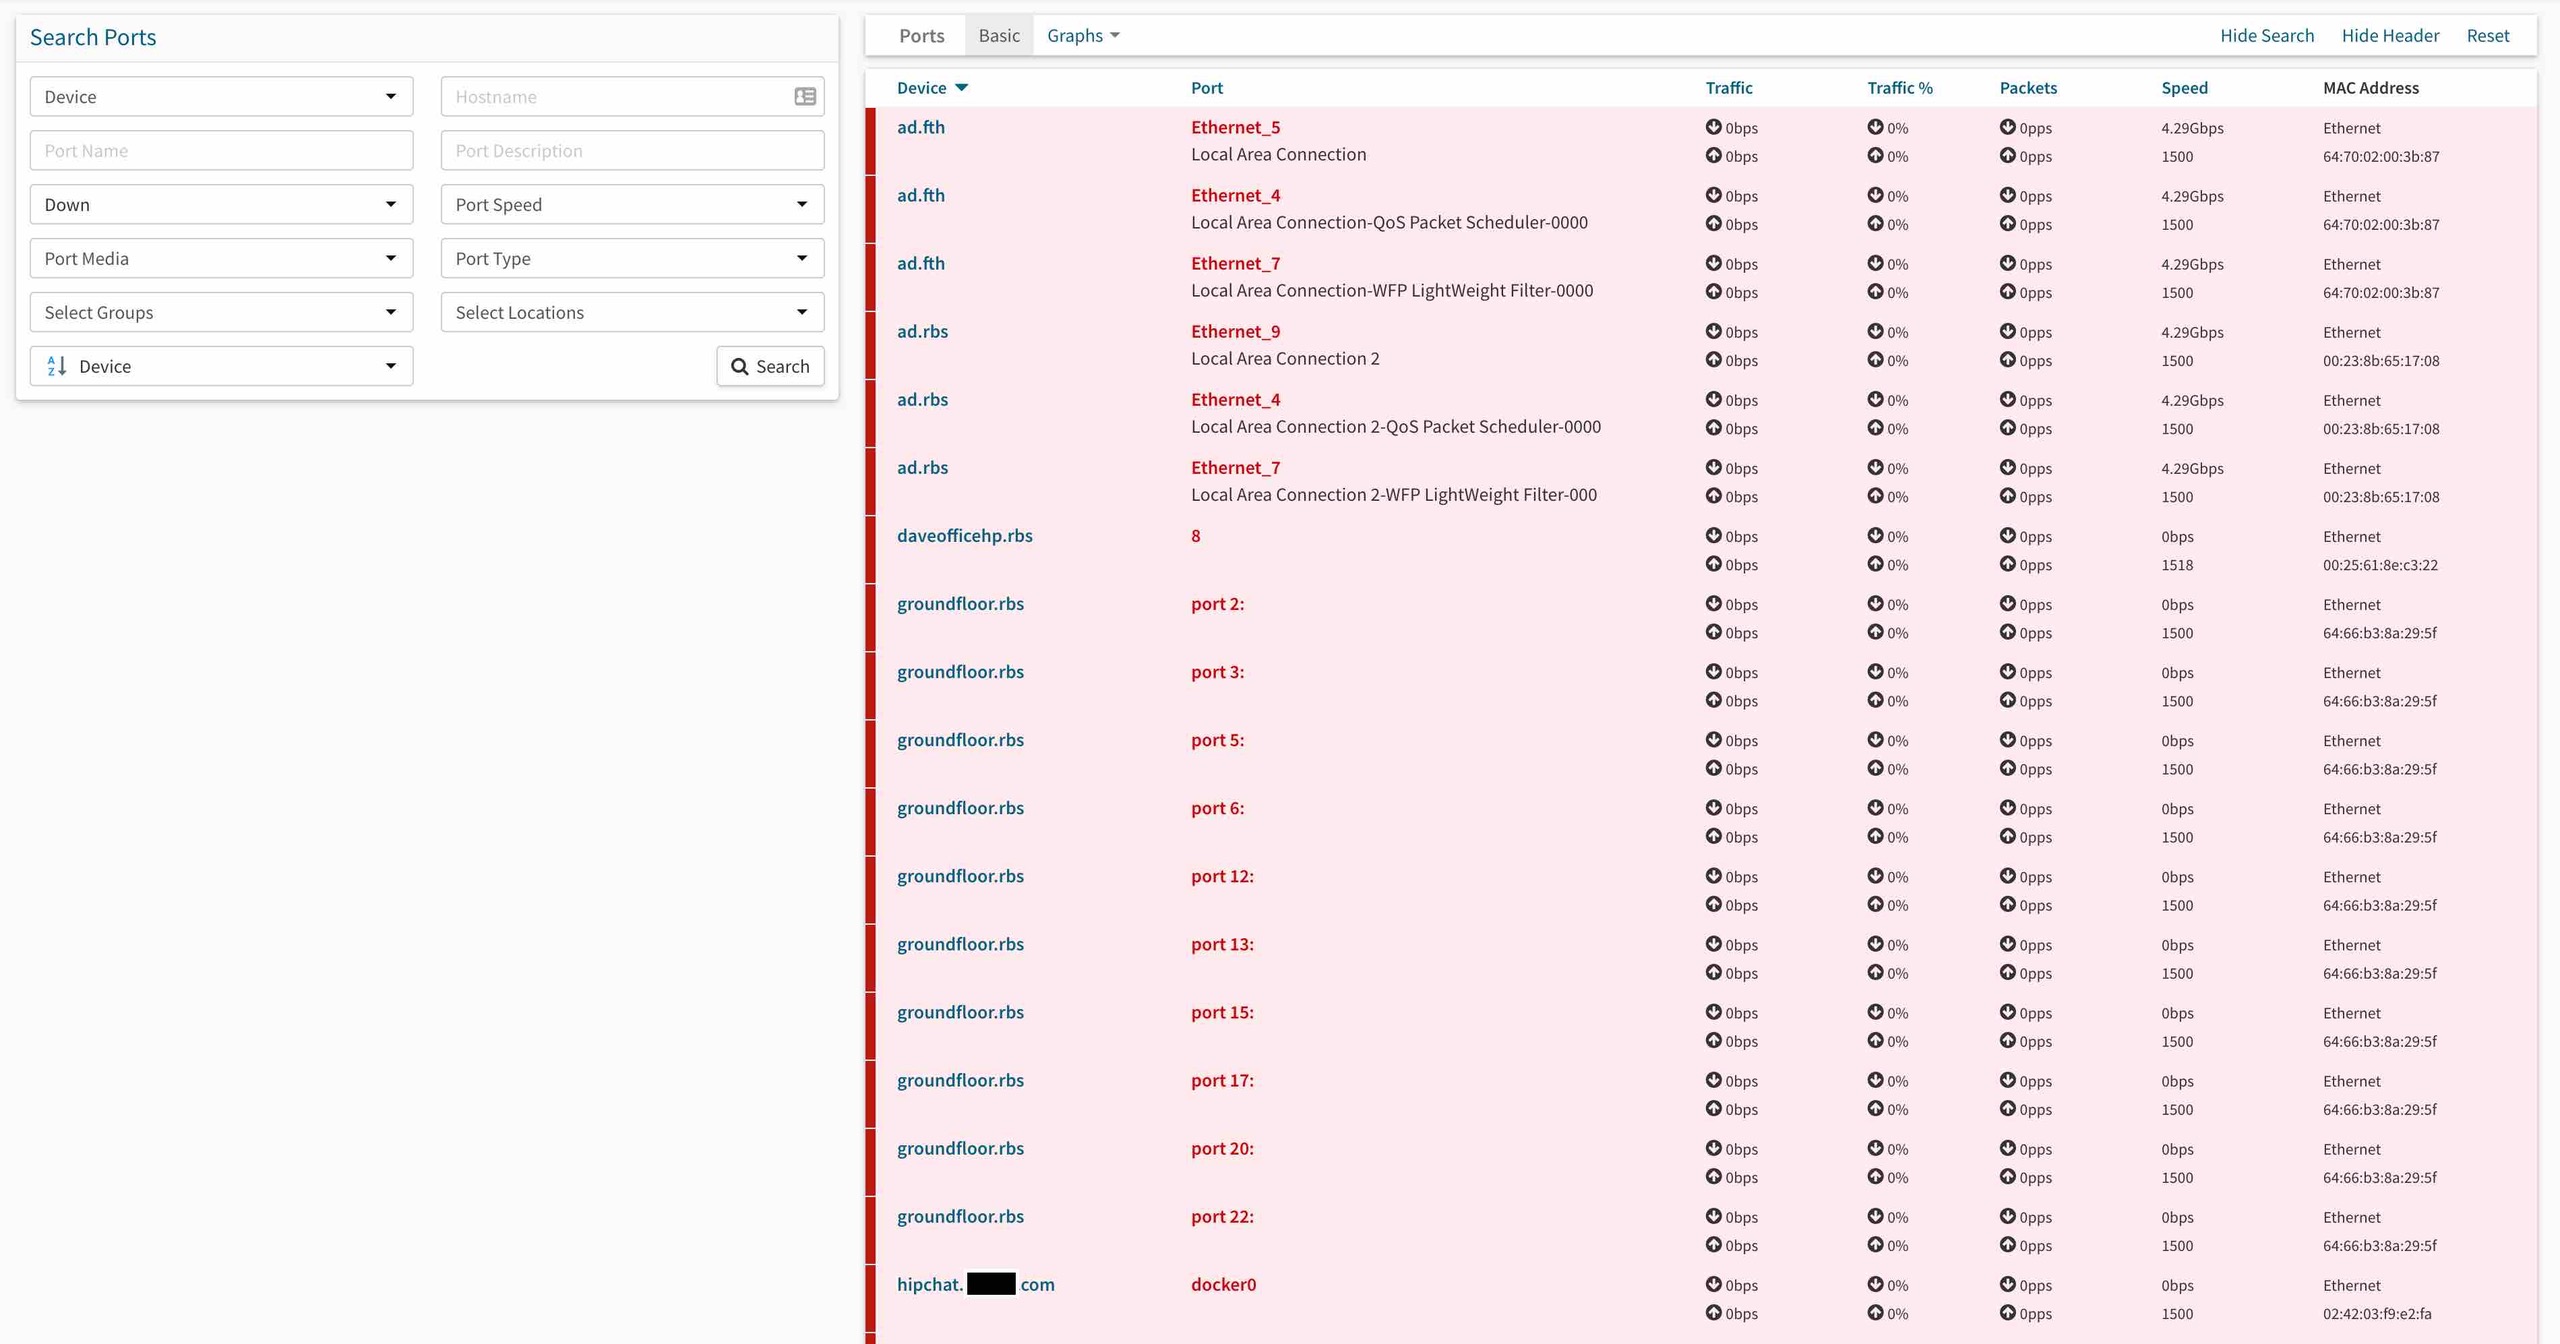
However, when you click the link, you don’t get any results: (the link goes to: https://observius.cdc.local/ports/state=down/ignore=0/ https://observius.cdc.local/ports/state=down/ignore=0/ )
<Picture (Device Independent Bitmap) 3.jpg>
So… How can I find out what/where/how these 12 ports are, so I can ‘resolve’ them please?
Cheers!
Robert Williams Custodian Data Centres https://www.CustodianDC.com https://www.custodiandc.com/
observium mailing list observium@observium.org mailto:observium@observium.org http://postman.memetic.org/cgi-bin/mailman/listinfo/observium http://postman.memetic.org/cgi-bin/mailman/listinfo/observium