
On 26/11/2012 14:09, Robert Williams wrote:
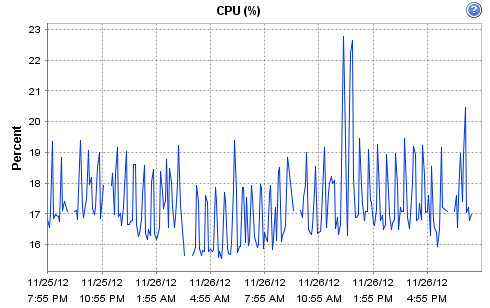
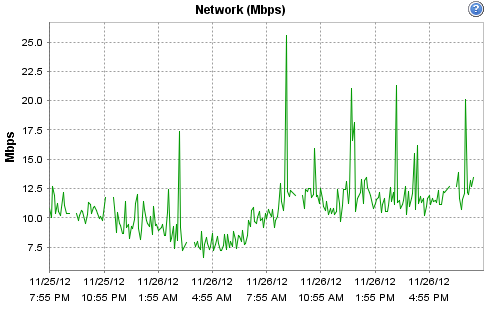
Hi -- yes it is indeed virtualised, the host is a Dell R710 - 12 Cores @ 2.4GHz / 16GB according to ESX. It's running on an enterprise grade Kingston SSD, along with Cacti. The host is fairly low-load (it only runs a few monitoring systems and a couple of virtual routers). CPU and network load on the physical host for today are:
It has a 1GB NIC and I've already checked but over the last 4 hours it hasn't dropped a single ICMP ping to any of the 4 targets I've been continuously polling directly from the Observium VM. Three of the targets were repeatedly showing as down, until I suspended a few hosts on the total devices list. For what it's worth, the other monitoring instance on there (Cacti) has about 7,000 data sources and isn't missing a single one. It is on a one-minute polling interval and takes between 10 and 12 seconds to complete. Observium has also been flawless up until now.
Interestingly, at 19:10 I moved to the poller-wrapper and re-enabled the hosts that I had disabled. Now CPU usage during each poll is approx 2x and the duration of the polling event is now about 45 seconds according to the wrapper.
Since that change, I've not had a host go down? It could be coincidence, so I'm going to leave it overnight without making any other changes and see if by the morning it has started doing it again.
Out of curiosity - is it possible, with a single poller instance (i.e. what I had before) that should a host respond correctly to the first SNMP get / ping, but then take a very long time to respond to the rest of the polls (say 5 seconds per OID), that it could delay the polling process enough for it to run out of time before hitting all the targets? Thus declare the rest it missed as 'down' because it never got around to them?
Nope, this isn't how the poller works, it's not smart enough to detect a "down" device during a polling run, it only does it at the very beginning.
The poller also doesn't have a fixed amount of time in which to run, it continues running until it's finished. It doesn't matter if it isn't finished before a new instance starts, because individual hosts will still be polled ~5 mins apart.
I only ask because if this is possible then it could explain why adding more hosts could lead to this as there are a couple which I know are particularly slow to respond. Specifically they are hardware-integrated SNMP modules on systems which run tiny ARM chips and linux 2.4.21-rmk1. They are _/slow/_ to get their answers back, especially if two systems are concurrently polling them. If it isn't possible, then that's obviously off the mark, but the fact that the wrapper (appears) to have resolved it makes me wonder enough to ask :)
It's possible that the additional devices shuffled the order in such a way that polling of the slower devices clashed with cacti and lead to device-down events. There are configuration variables to change the timeout and retries for SNMP.
If it's not that, the only thing that I can think of that is causing this is some I/O bottleneck, either disk I/O causing a knock-on effect elsewhere or a network I/O bottleneck. If it was anything in the code we'd have lots and lots of people complaining!
If it persists, you could try reverting the only change we made to code used by the poller, the RRD loop. Remove the "i++;" from the loop in the middle of includes/rrdtool.inc.php.
adam.