
Hi Adam,
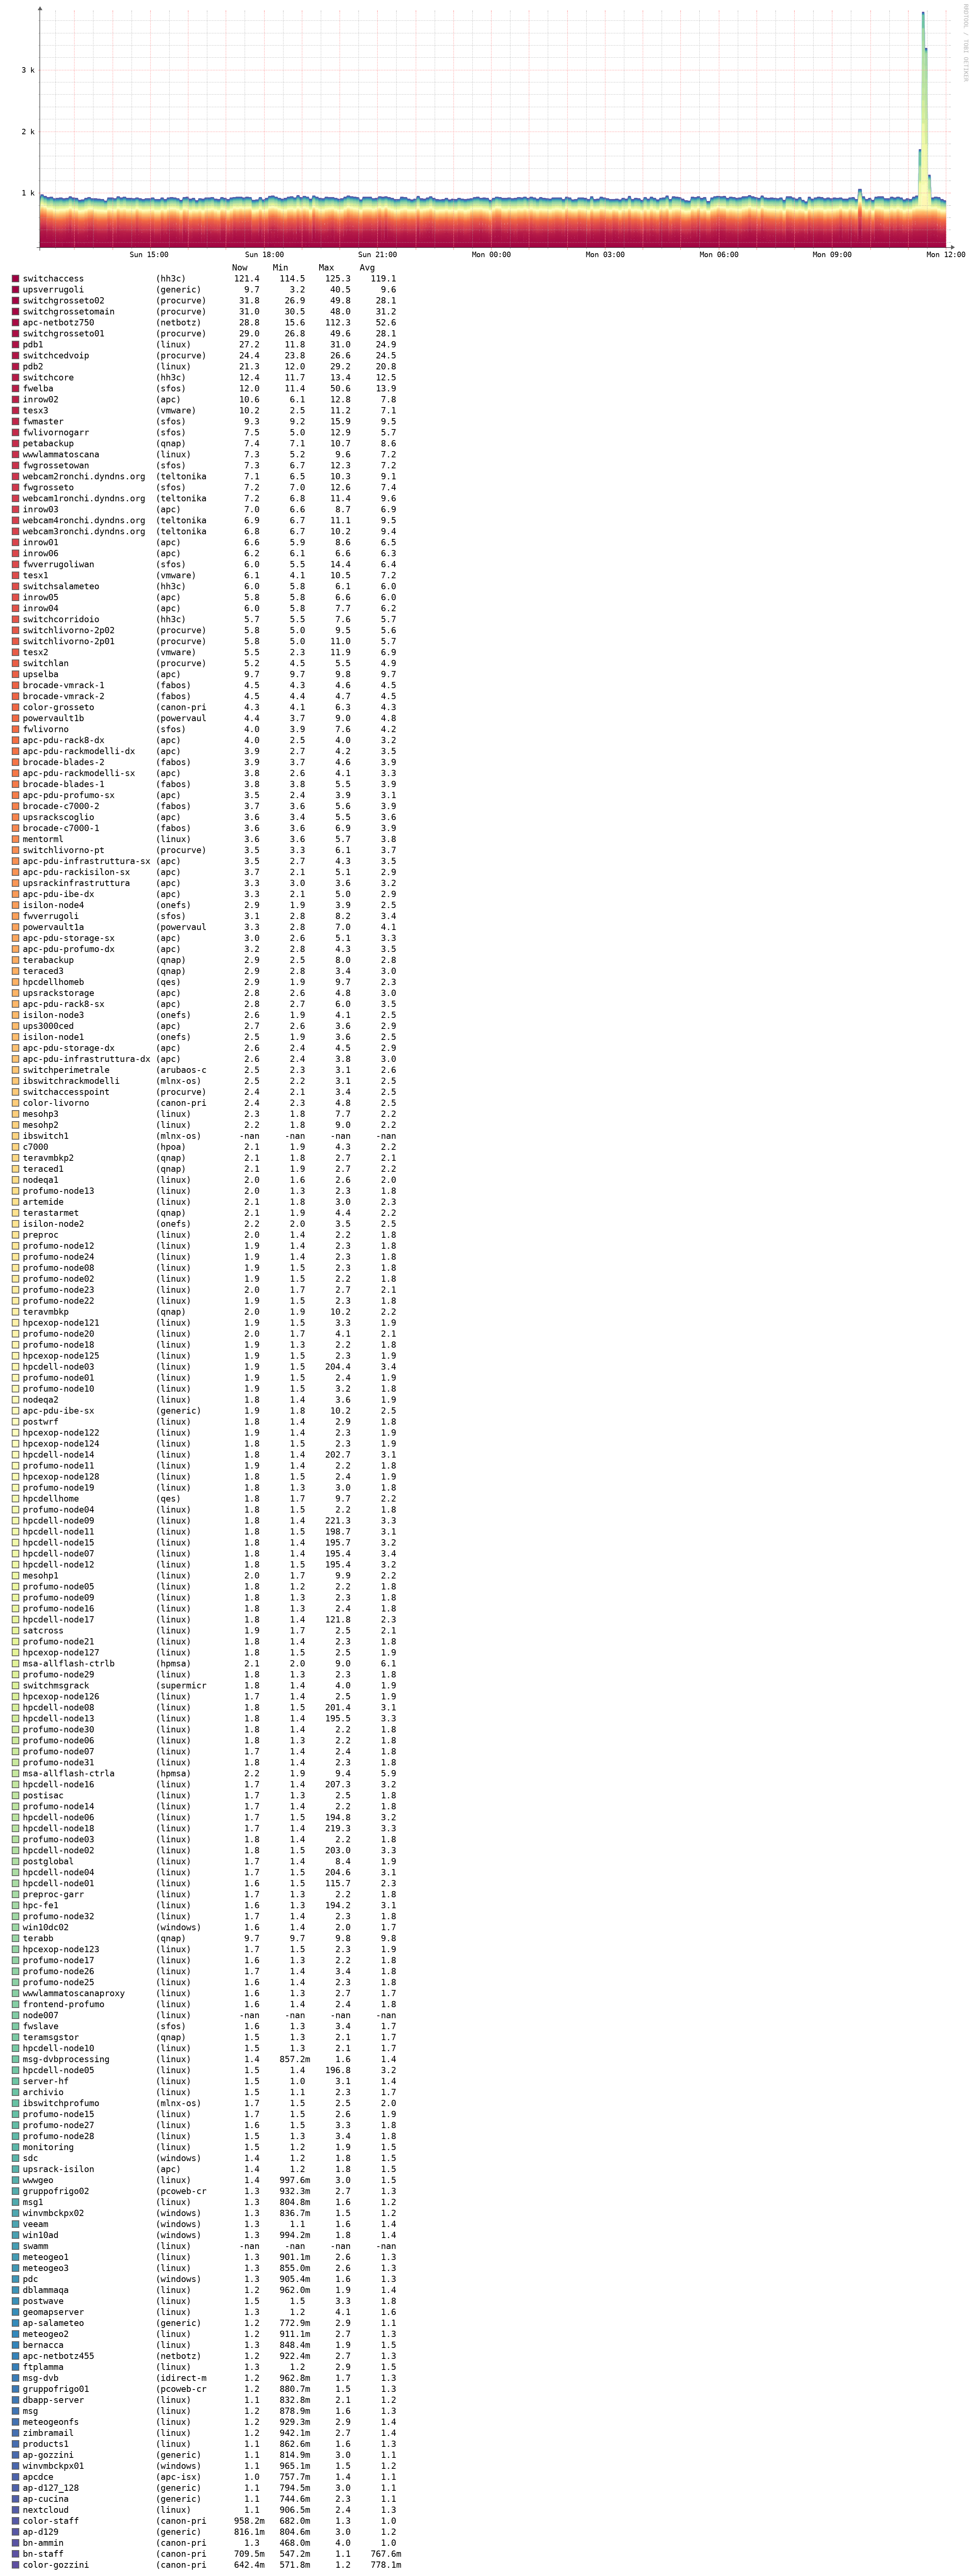
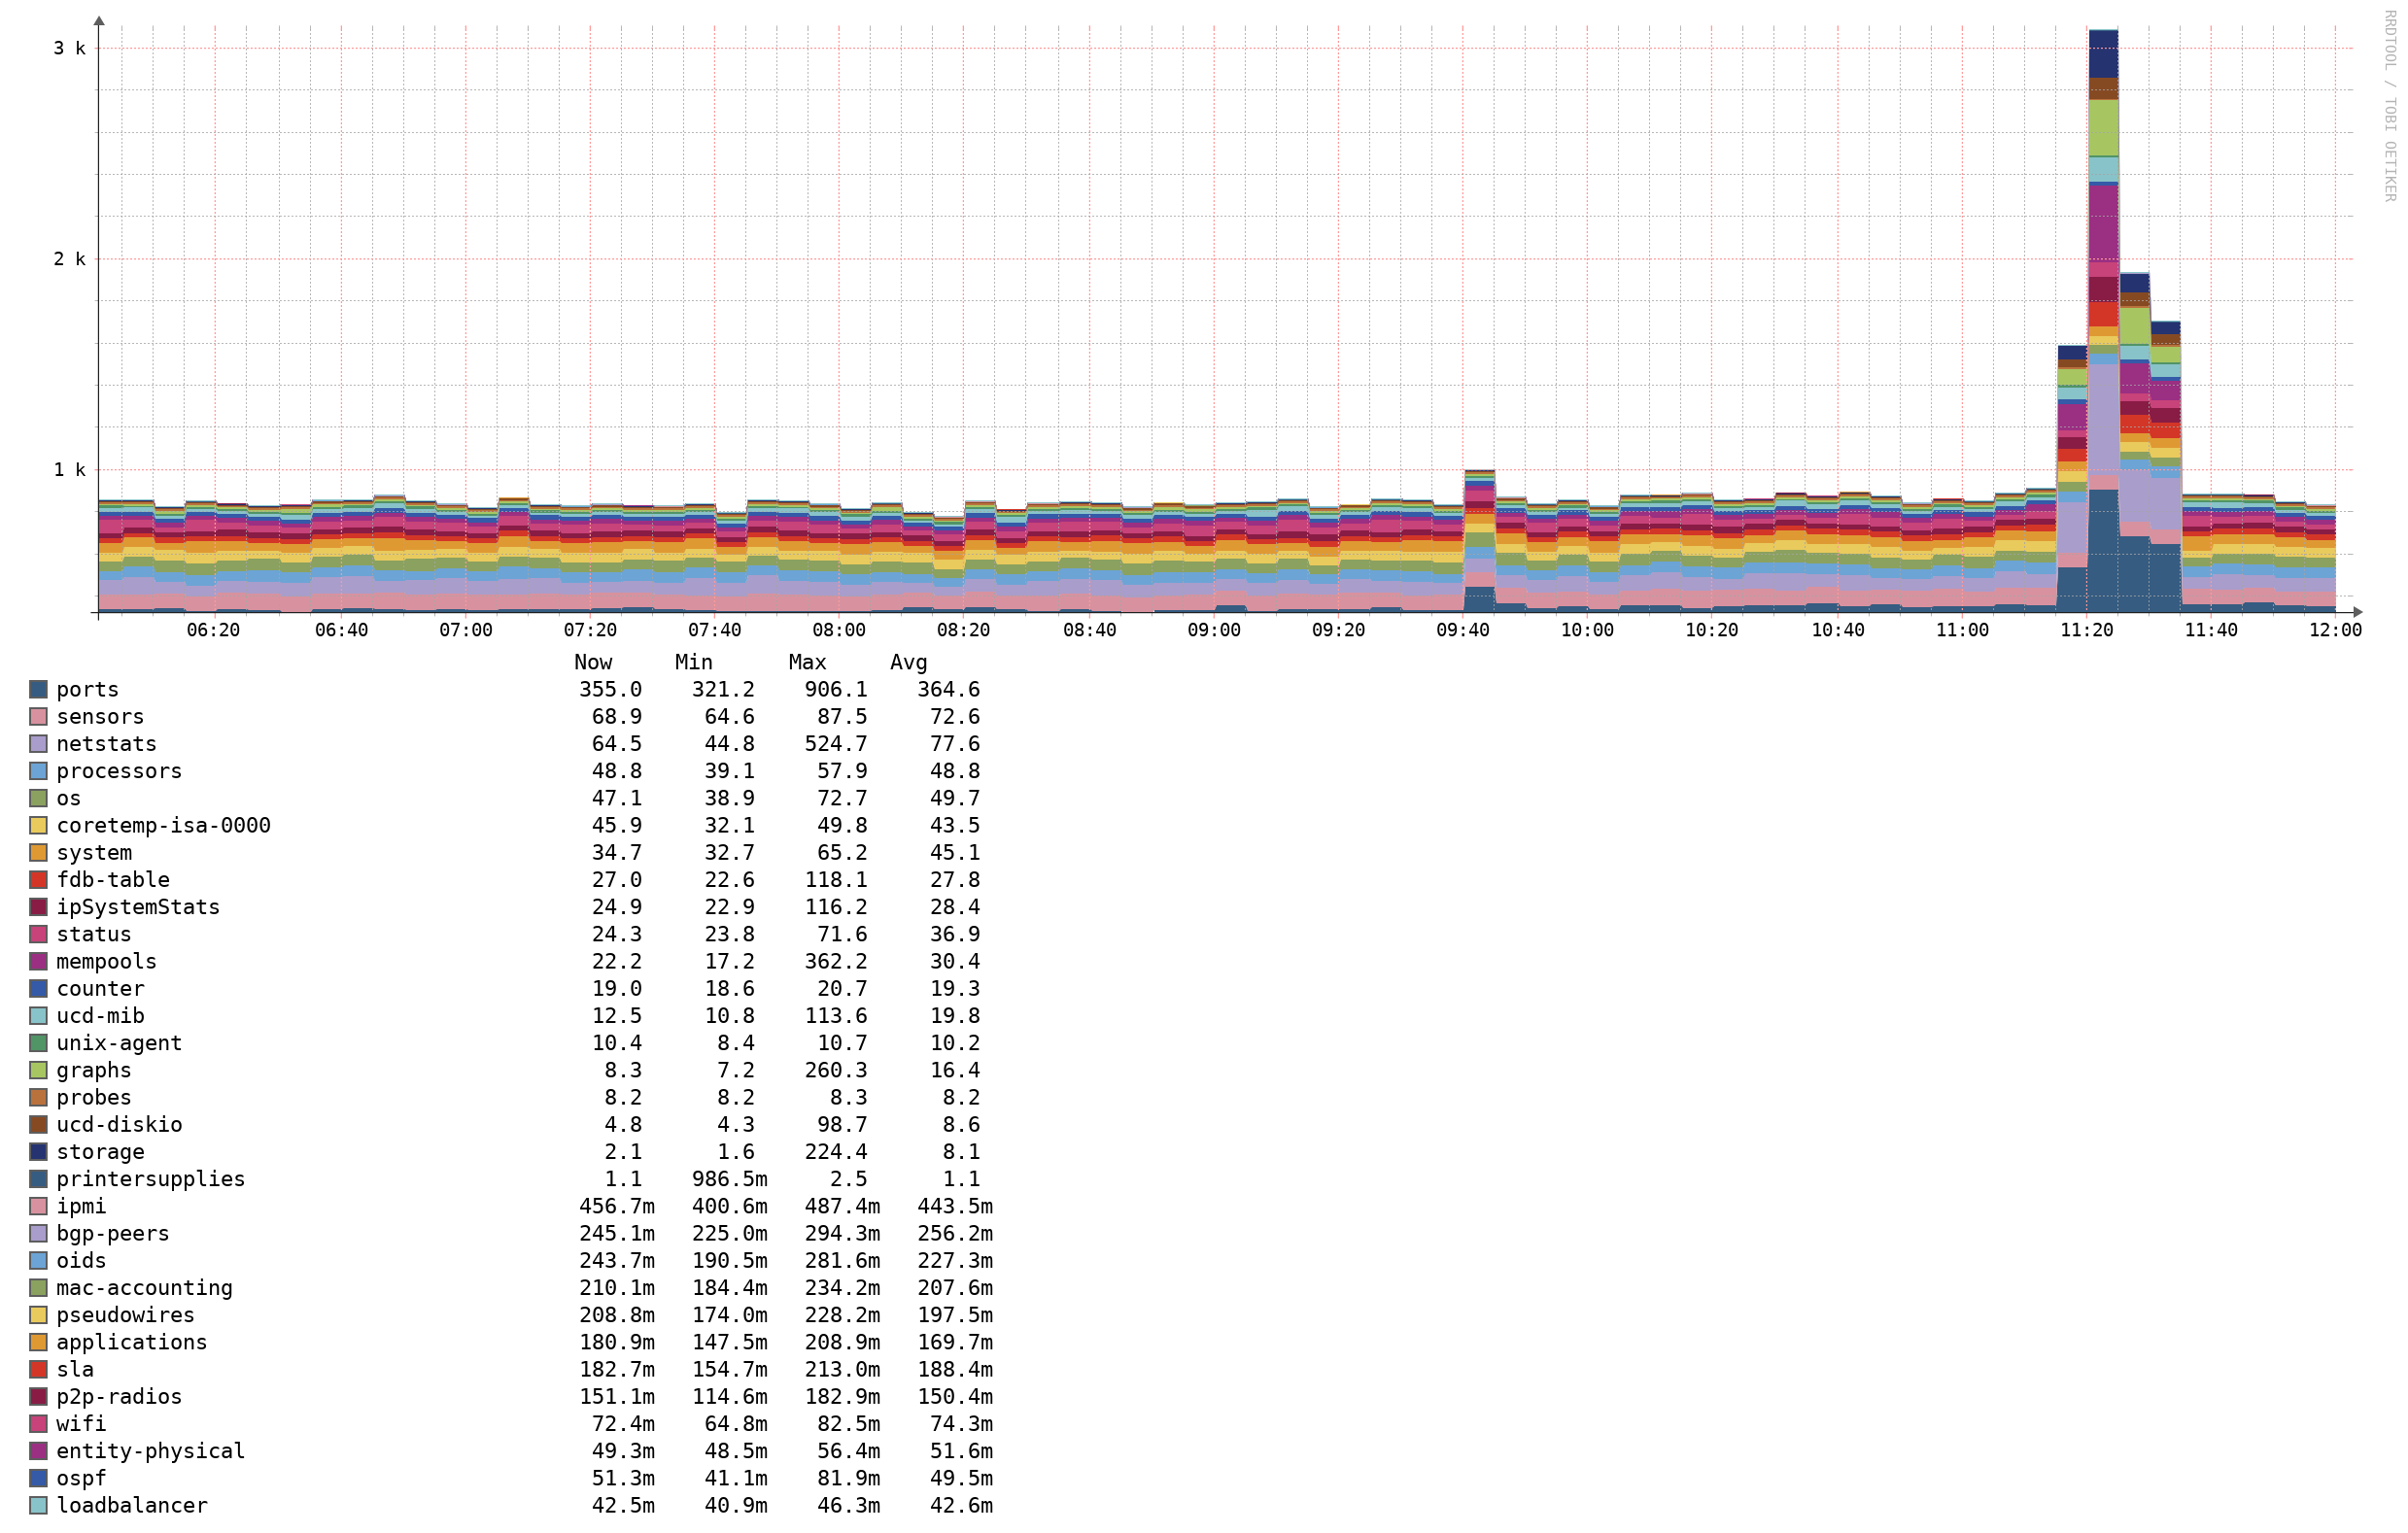
Thank you for your reply. I’ve attached some poller graphs for reference. Specifically, in the per-module graph, I noticed several false alarms this morning reporting that multiple servers were down — while in fact they were running correctly. The timing of these false alerts seems to correspond with the spikes visible in the graphs. I’m unsure how to further debug this. I tried reviewing the poller graphs for the affected devices, and while I do see spikes aligning with the alarms, the root cause is unclear. It almost looks like Observium is randomly “missing” polling cycles — though it might also be due to some external component being overloaded and unable to keep up with the poller load. Any advice on where to look next would be appreciated. Best regards, Simone
From: "Observium" observium@lists.observium.org To: "Observium" observium@lists.observium.org Cc: "Adam Armstrong" adama@observium.org Sent: Tuesday, June 10, 2025 1:37:55 PM Subject: [CAUTION: SUSPECT SENDER] [Observium] Re: sensors and devices up down false alarms
The polling information pages would be useful to look at, they’re in the cog menu on the main menu bar. These two graphs are generated from different MIBs. Is there a third Extended graph? It might show wait time, which is perhaps where the difference is. The detailed graph is mostly useful for older systems that don’t expose the newer OIDs.
Also the load average graph might be useful.
Poller load can increase a little over time as we add more things and the code gets a bit more complicated, but I don’t think that should be significant over the past couple of years.
Adam.
On 10 Jun 2025, at 14:52, Simone Montagnani via observium observium@lists.observium.org wrote:
In the last months I'm starting to get some issues I cannot debug well . I have some alert of devices up&down that are not really going down even at ping check. I'm sure that there are no network issues as we are talking about near switch devices, I'm starting to think that I need to debug if our observium is starting to "saturate" and the performance get poor. is there something I can check to find if we need to tune observium ? Or best practices tI can use ?
CPU occupation graphs are kind of weird, processors occupation is different between Processors and Detailed Processors graphs :
<Screenshot 2025-06-10 at 11.20.18.png>
any idea is welcome
Best Regards
Simone _______________________________________________ observium mailing list -- observium@lists.observium.org To unsubscribe send an email to observium-leave@lists.observium.org
_______________________________________________ observium mailing list -- observium@lists.observium.org To unsubscribe send an email to observium-leave@lists.observium.org