
I'm sorry - I don't immediately have a clue on how to remove data. You could export to XML, remove a bunch of entries (or replace by NaN?) then import the XML again. It's manual labour I'm afraid though. Not sure if it's scriptable.
You could try running the removespikes script over the RRDs and see if they bring down the giant peak?
Tom
On 04/28/2016 03:24 PM, Robert Williams wrote:
Hi Tom,
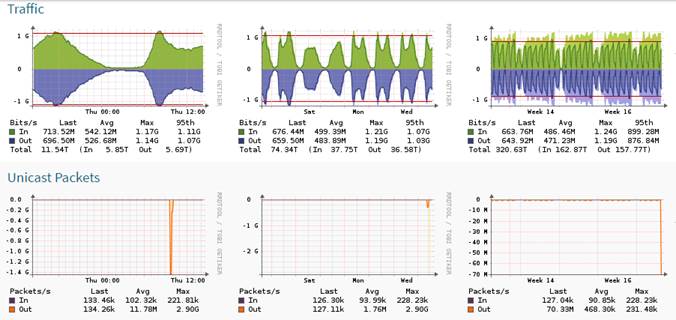
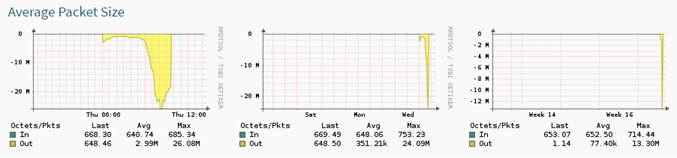
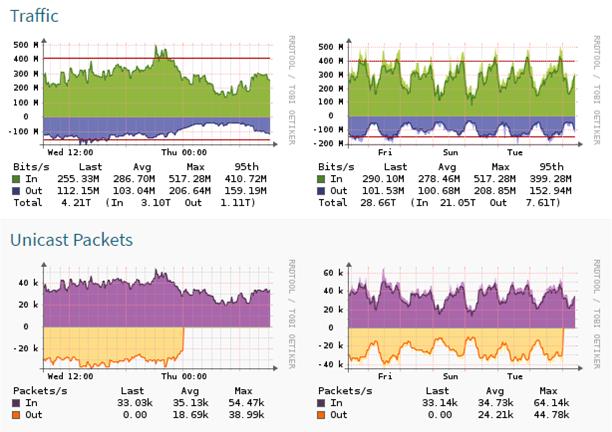
Thanks very much for that! – Do you have any pointers on a script to erase the time range from all the RRDs?
It’s messed up most of the long-term views for all the ports now:
Cheers!
Robert Williams Custodian Data Centre Email: Robert@CustodianDC.com http://www.CustodianDC.com
*From:*observium [mailto:observium-bounces@observium.org] *On Behalf Of *Tom Laermans *Sent:* 28 April 2016 09:37 *To:* Observium Network Observation System observium@observium.org *Subject:* Re: [Observium] Graph data failures
Robert,
Indeed, thanks for the report.
Fixed in r7784.
Tom
On 04/28/2016 10:18 AM, Robert Williams wrote:
Hi,

Since our midnight svn up / rediscover, it appears that every port
graph has moved the “Unicast Packets Out” data into the “Errors
TX” graph?!

Images below:

This is on _all_ devices on _all_ port graphs, as far as I can see
anyway…

Including on our test installation polling some lab devices, on a
different VM.

Help please?

Robert Williams

Custodian Data Centre

Email: Robert@CustodianDC.com <mailto:Robert@CustodianDC.com>

http://www.CustodianDC.com


_______________________________________________

observium mailing list

observium@observium.org <mailto:observium@observium.org>

http://postman.memetic.org/cgi-bin/mailman/listinfo/observium
observium mailing list observium@observium.org http://postman.memetic.org/cgi-bin/mailman/listinfo/observium