
It’s probably better to explain what problem you’re trying to solve, rather than asking how to do what you think is the way to solve it. You’ll often get the same answer, but not always.
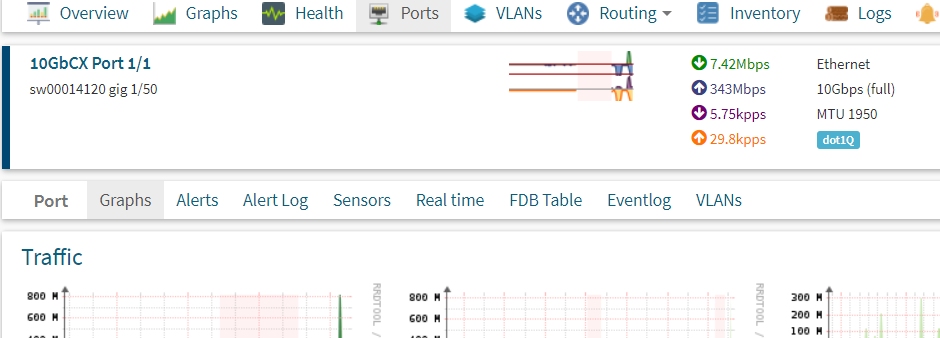
Also, what browser/OS is that screenshot from? It seems to have made a horrible mess of the graphics, not loading the high dpi versions.
Adam.
From: observium [mailto:observium-bounces@observium.org] On Behalf Of Meyer, Florian via observium Sent: 23 March 2020 12:31 To: 'observium@observium.org' observium@observium.org Cc: Meyer, Florian Florian.Meyer@med.uni-rostock.de Subject: [Observium] How to add per Port Graphs?
Hi Guys,
I need to add some per port graphs via definitions.
Does anybody have experience in adding new graphs to the port-graphs?
Regards,
i. A. Florian Meyer
IT-Systemadministrator
Dezernat IT
Universitätsmedizin Rostock
Rembrandtstr. 17a
18057 Rostock
Tel.: +49 381 494 3364
Fax: +49 381 494 3302
http://it.med.uni-rostock.de/ http://it.med.uni-rostock.de
Tel. Network Operations Center: +49 381 494 3388