
24 Jan
2022
24 Jan
'22
12:45 p.m.
Hi,
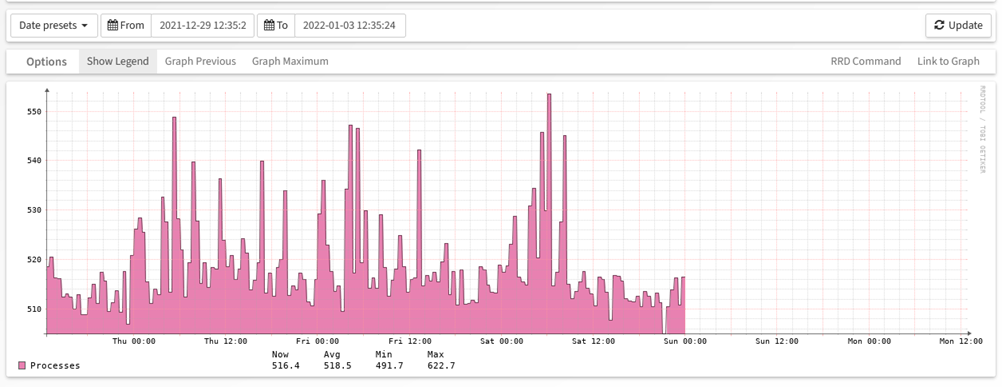
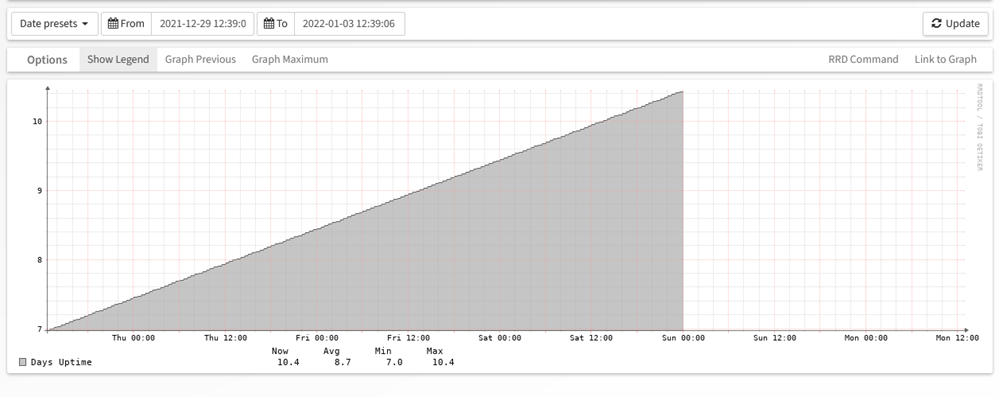
I did not notice it earlier but somehow all graphs stopped on Jan 1st 00:00 ?
Doesn't matter for which device I look or at what type of graph. The graphs look like this:
[cid:image003.png@01D81120.552DF310]
[cid:image004.png@01D81120.552DF310]
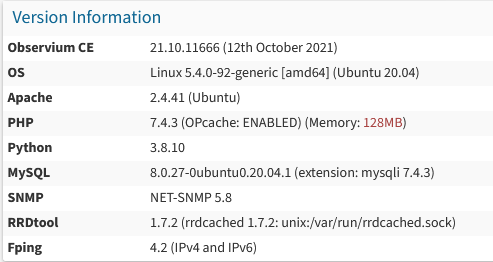
Does anyone have seen this before? I haven't made changes to the Observium installation recently. I only updated the OS where Observium is running (was running on an old Ubuntu 16.02 version and is now upgrades to Ubuntu 20.04). But that was done in week 50 (the week of Dec 13th) and after that the graphs still worked.
So strange that it exactly stopped at midnight of the new year?
[cid:image005.png@01D81120.552DF310]
If anybody got tips how to get this working again please let me know.
Thank you, Richard