
There were.
I've purged them. Ran: ./poller.php -h all
It still shows.
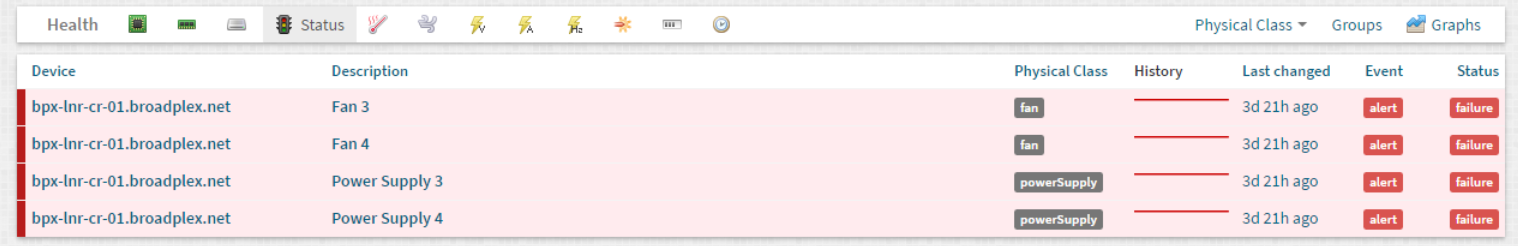
Also, how do I ignore hardware that shows errors? I ignored the alerts but the Dashboard still shows items in red. [image: Inline image 1]
The Fan/PSUs aren't installed. Is there a way to ignore just those line items without ignoring the entire device?
On Mon, May 2, 2016 at 1:53 PM, Adam Armstrong adama@memetic.org wrote:
Are there any deleted ports?
Adam.
Sent from BlueMail http://www.bluemail.me/r
On May 2, 2016, at 19:41, Josh Hopper josh@miamiconsultant.com wrote:
I managed to get alerts working and its great. I did have a few questions though.
Ideally, I'd like it if there were nothing in red on the dashboard (as if there are issues).
[image: Inline image 1]
Observium says I have a port down and 1 alert failed.
However, all alerts are either OK or suppressed. Ports are either on and in use or disabled.
There is nothing that shows in those lists. Any reason why it says that something is down?
Your help is appreciated. Thanks.
-- JOSHUA HOPPER NETWORK ENGINEER 1-828-558-1403 Joshua.Hopper@broadplex.net www.broadplex.net
observium mailing list observium@observium.org http://postman.memetic.org/cgi-bin/mailman/listinfo/observium
observium mailing list observium@observium.org http://postman.memetic.org/cgi-bin/mailman/listinfo/observium