
Hi,
I'm having a problem with the graphs of all my devices in observium (screenshots attached). What is the advisable crontab settings should I use given the list of devices I am polling? for the list of devices it is in attachment 1
Here are the details of my environment.
*Observium* 0.13.7.4172 *Apache* 2.2.15 (CentOS) *PHP* 5.3.3 *MySQL* 5.1.69 *RRDtool* 1.3.8
Crontab settings: */10 * * * * root /opt/observium/poller-wrapper.py 1 >> /dev/null 2>&1 */10 * * * * root /opt/observium/poller.php -h all >> /dev/null 2>&1
Recent output of TOP: top - 00:44:01 up 1 day, 18:35, 1 user, load average: 2.89, 2.26, 2.24 Tasks: 187 total, 5 running, 182 sleeping, 0 stopped, 0 zombie Cpu(s): 13.1%us, 65.9%sy, 0.0%ni, 20.5%id, 0.2%wa, 0.0%hi, 0.3%si, 0.0%st Mem: 5059868k total, 905692k used, 4154176k free, 153836k buffers Swap: 4161528k total, 0k used, 4161528k free, 481076k cached
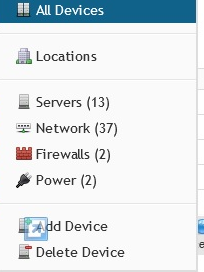
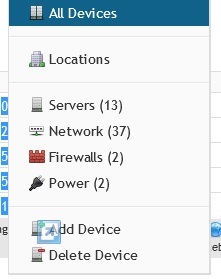
Attachment 1: observium1.jpg list of devices
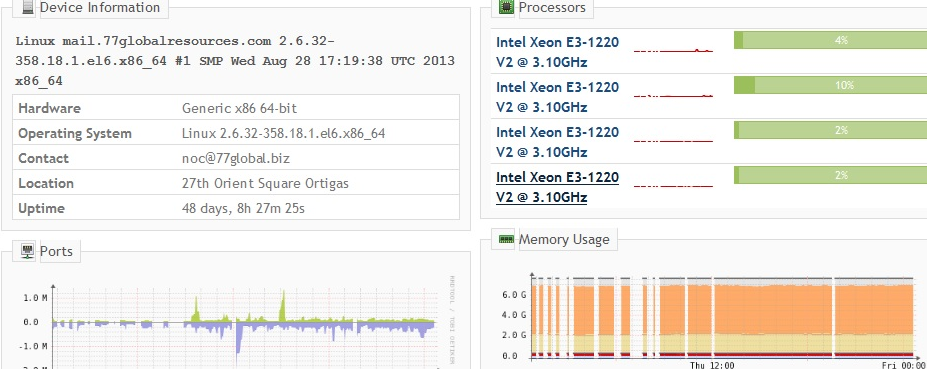
Attachment 2: observium2.jpg snapshot of one linux mail server
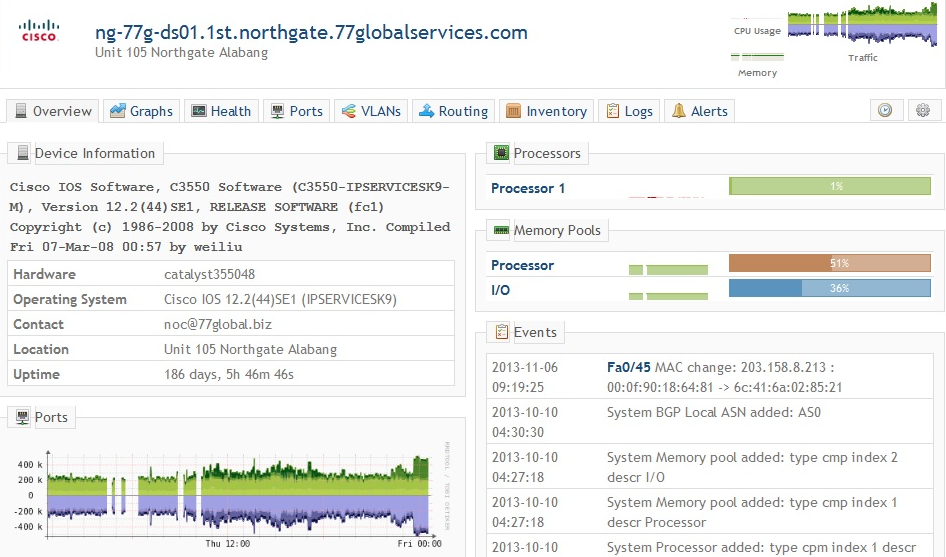
Attachment 3: observium3.jpg snapshot of network switch device
Best Regards, Jerico M. Rubion