
Hi,
This might be my lack of understanding of the memory pools' representations in Observium, or it might be a bug.
There seems to be a significant difference in the memory being reported by Observium and that which is reported by the device.
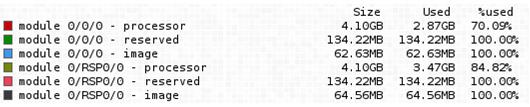
Here is the console output for the two processors (SP and RSP) along with the graph values from Observium:
#sh mem sum location 0/0/CPU0 Physical Memory: 8192M total Application Memory : 8004M (5264M available) <- approx. 34% used Image: 59M (bootram: 59M) Reserved: 128M, IOMem: 0, flashfsys: 0 Total shared window: 347M
#sh mem sum location 0/RSP0/CPU0 Physical Memory: 8192M total (4688M available) <- approx. 41% used Application Memory : 8002M (4688M available) Image: 61M (bootram: 61M) Reserved: 128M, IOMem: 0, flashfsys: 0 Total shared window: 133M
The "Reserved" and "Image" ones are always 100% - but that's a different issue I think.
What I'm more interested in is the RSP and SP "Processor" element, which both show very different amounts to the real usage. In fact, I can't even remotely line them up with anything on the box itself.
So, any ideas or am I just reading this all wrong?
Cheers!
Robert Williams Custodian Data Centre Email: Robert@CustodianDC.com http://www.CustodianDC.com