
Hi,
please send discovery debug output:
./discovery.php -d -m os,sensors -h <this_device>
On 26.02.16 11:51, Sandy Breeze wrote:
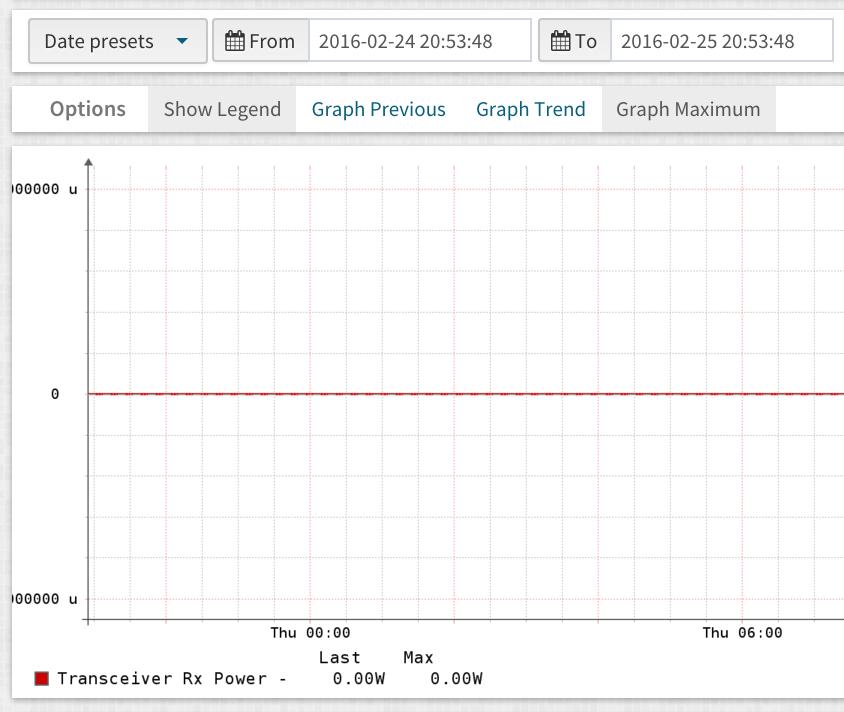
Well this is what Observium displays when graphing the sensor:
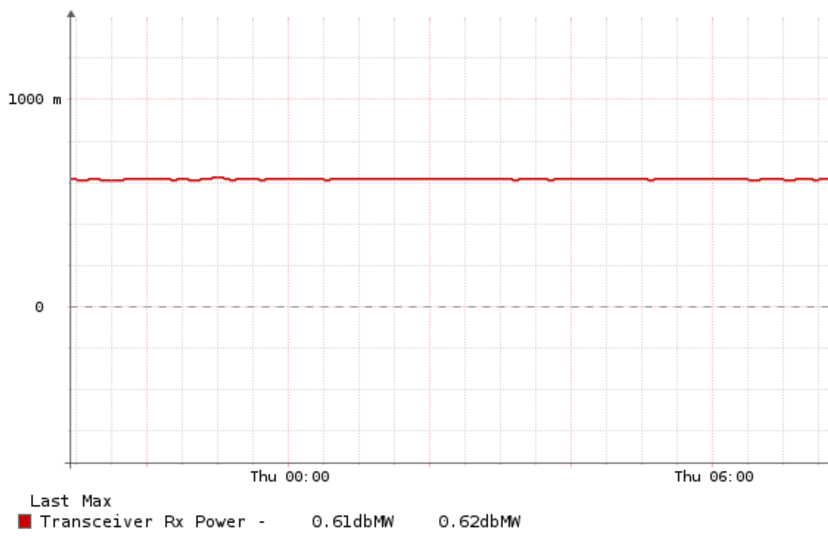
But if I use the same RRD and graph it myself, I get:
This graph was generated with: rrdtool graph rrd.png \ -Y \ --lower-limit 0 \ --alt-autoscale-max \ --start 1456347228 \ --end 1456433628 \ --width 1152 \ --height 300 \ -c BACK#EEEEEE00 \ -c SHADEA#EEEEEE00 \ -c SHADEB#EEEEEE00 \ -c FONT#000000 \ -c CANVAS#FFFFFF00 \ -c GRID#a5a5a5 \ -c MGRID#FF9999 \ -c FRAME#5e5e5e \ -c ARROW#5e5e5e \ -R normal \ --font LEGEND:8:'DroidSansMono,DejaVuSansMono' \ --font AXIS:7:'DroidSansMono,DejaVuSansMono' \ --font-render-mode normal \ -E \ -A COMMENT:' Last Max\n' \ DEF:sensor=/srv/www/iss/observium/rrd/t40-ar14/sensor-power-cisco-entity-sensor-58513400.rrd:sensor:AVERAGE \ DEF:sensor_max=/srv/www/iss/observium/rrd/t40-ar14/sensor-power-cisco-entity-sensor-58513400.rrd:sensor:MAX \ DEF:sensor_min=/srv/www/iss/observium/rrd/t40-ar14/sensor-power-cisco-entity-sensor-58513400.rrd:sensor:MIN \ CDEF:sensor_mult=sensor,1000,* \ CDEF:sensor_mult_max=sensor_max,1000,* \ CDEF:sensor_mult_min=sensor_min,1000,* \ AREA:sensor_max#c5c5c5 \ AREA:sensor_min#ffffffff \ LINE1.5:sensor_mult#cc0000:'Transceiver Rx Power -' \ GPRINT:sensor_mult_min:LAST:%6.2lfdbMW \ GPRINT:sensor_mult_max:MAX:%6.2lfdbMW\l \ HRULE:0.0009585#999999::dashes Sandy
On 25/02/2016, 23:46, "observium on behalf of Adam Armstrong" <observium-bounces@observium.org mailto:observium-bounces@observium.org on behalf of adama@memetic.org mailto:adama@memetic.org> wrote:
Pictures speak a thousand words. adam.On 25/02/2016 21:30:43, Sandy Breeze <sandy.breeze@eu.clara.net <mailto:sandy.breeze@eu.clara.net>> wrote: Hi, Currently running: 0.16.1.7533 (26th January 2016) We’ve noticed the DOM optic power sensor data to be graphed at 0W all the time. Noticing the ‘value’ figure is correct on the optic’s power status page, we subsequently found all data in the RRD to be correct. eg: <!-- 2016-02-25 20:50:00 GMT / 1456433400 --> <row><v>6.1840000000e-04</v></row> <!-- 2016-02-25 20:55:00 GMT / 1456433700 --> <row><v>6.1300000000e-04</v></row> <!-- 2016-02-25 21:00:00 GMT / 1456434000 --> <row><v>6.1435000000e-04</v></row> It just seems the rrdtool graph function is not rendering this sensor data with anything useful. The graph is being generated with something like this: rrdtool graph /tmp/FLjPO7rtfRJQOfGn.png -Y --lower-limit 0 --alt-autoscale-max --start 1456347228 --end 1456433628 --width 1152 --height 300 -c BACK#EEEEEE00 -c SHADEA#EEEEEE00 -c SHADEB#EEEEEE00 -c FONT#000000 -c CANVAS#FFFFFF00 -c GRID#a5a5a5 -c MGRID#FF9999 -c FRAME#5e5e5e -c ARROW#5e5e5e -R normal --font LEGEND:8:'DroidSansMono,DejaVuSansMono' --font AXIS:7:'DroidSansMono,DejaVuSansMono' --font-render-mode normal -E -A COMMENT:' Last Max\n' DEF:sensor=/srv/www/iss/observium/rrd/t40-ar14/sensor-power-cisco-entity-sensor-58513400.rrd:sensor:AVERAGE DEF:sensor_max=/srv/www/iss/observium/rrd/t40-ar14/sensor-power-cisco-entity-sensor-58513400.rrd:sensor:MAX DEF:sensor_min=/srv/www/iss/observium/rrd/t40-ar14/sensor-power-cisco-entity-sensor-58513400.rrd:sensor:MIN AREA:sensor_max#c5c5c5 AREA:sensor_min#ffffffff LINE1.5:sensor#cc0000:'Transceiver Rx Power -' GPRINT:sensor:LAST:%6.2lfW GPRINT:sensor:MAX:%6.2lfW\\l HRULE:0.0009585#999999::dashes Seeing the data collected is in the order of 10^-4 d.p. small, how can we stop this being rounded to 0 all the time on a the graph? I understand completely this is rrdtool not automatically choosing a very good scale for you, but is there any way to detect these low values and fix them up for the graphs by order of 1000 say? Cheers Sandy
observium mailing list observium@observium.org http://postman.memetic.org/cgi-bin/mailman/listinfo/observium