
Hi,
Good day.
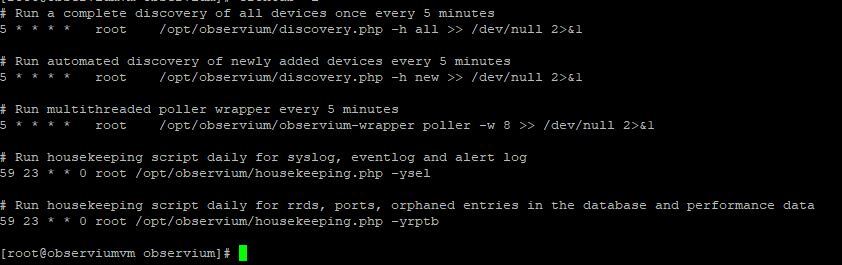
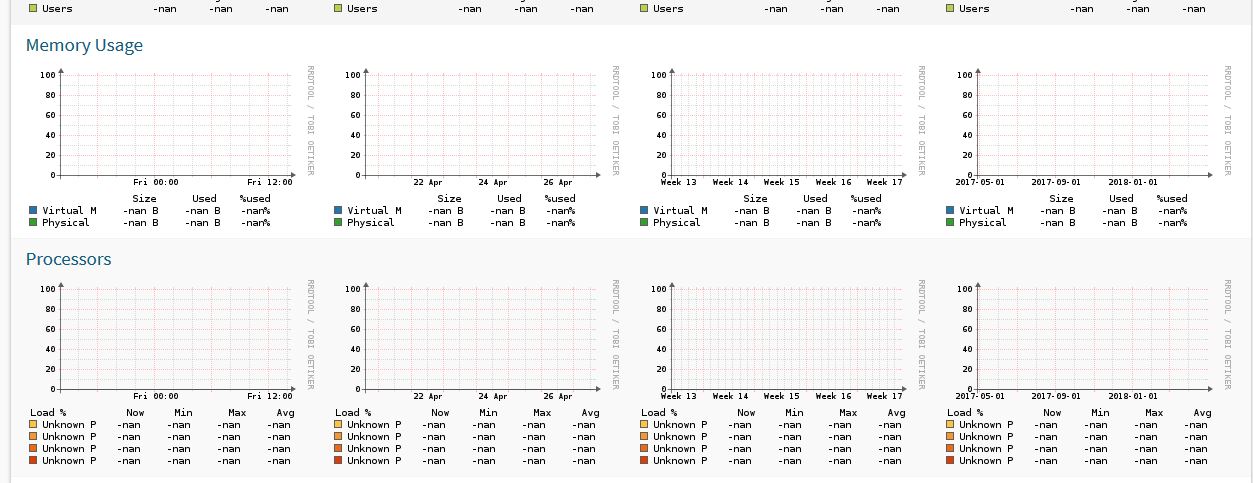
I have problem with my observium graph not showing anything. I aldi make sure the config.php does not have empty line, tried switching browser, give permission to rrd folder. but it still not showing anything. My /opt/observium/logs does not give any error. May I know how may I trobleshoot this?
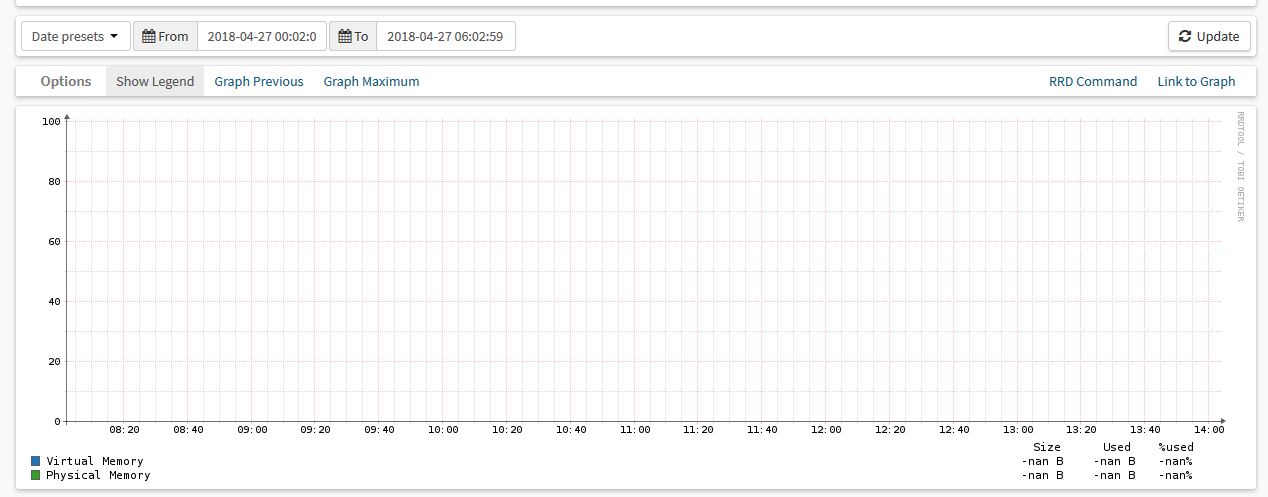
Attached is some information from my observium server. My setup is on centos7 and my monitoring device is a windows 10 latop. Also, in graph 2, the timing in the filter and the timing in the graph is different. (refer to graph2.jpg) I did perform time modification after setup observium and the time on the graph did changed to the correct time. But the filter is showing different time. I try remove the observium folder, and reunpack, drop database and recreate the database. Still the result is the same. I wonder if this is the reason the graph is not working.
Really appreciate if anyone can help out on this.