
thanks, solved
El mar, 21 dic 2021 a las 13:40, Adam Armstrong via observium (< observium@observium.org>) escribió:
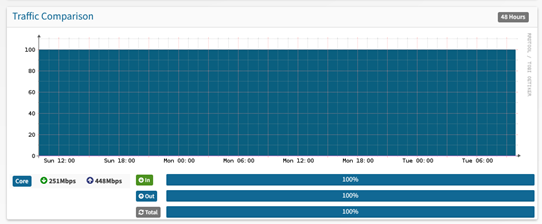
This widget shows groups of ports relative to other groups of ports, the total is always 100%, it won’t create what you want with just one group of ports, since that group is always 100% of the total.
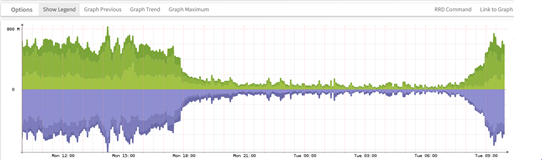
You just want to add an individual port group bits graph to the dashboard, you can do this using the “add to dashboard” options on the graph browser (the bottom image)
Adam.
*From:* observium observium-bounces@observium.org *On Behalf Of *Arnoldo Vidal Bravo via observium *Sent:* 21 December 2021 13:01 *To:* Observium observium@observium.org *Cc:* Arnoldo Vidal Bravo arnoldo.vidal@pucv.cl *Subject:* [Observium] graph on home page
hi,
I need show a traffic in and out (graph) only on 1 interface, how i can do?
i have a group for identify the interface... device in X and port label short Y, but only show the totals, not detail
i hope to view this
--
Saluda cordialmente
[image: Image removed by sender.]
observium mailing list observium@observium.org http://postman.memetic.org/cgi-bin/mailman/listinfo/observium