
Hi Mike,
Here is the screen shot, before I paste up the debug output (and me being a "tool") does the debug output carry anything that needs removing, I see the hostname in there, but, although I removed the hostnames from the screenshot, pretty pointless now when looking at this file, I just want to make sure no passwords or anything are in it. :)
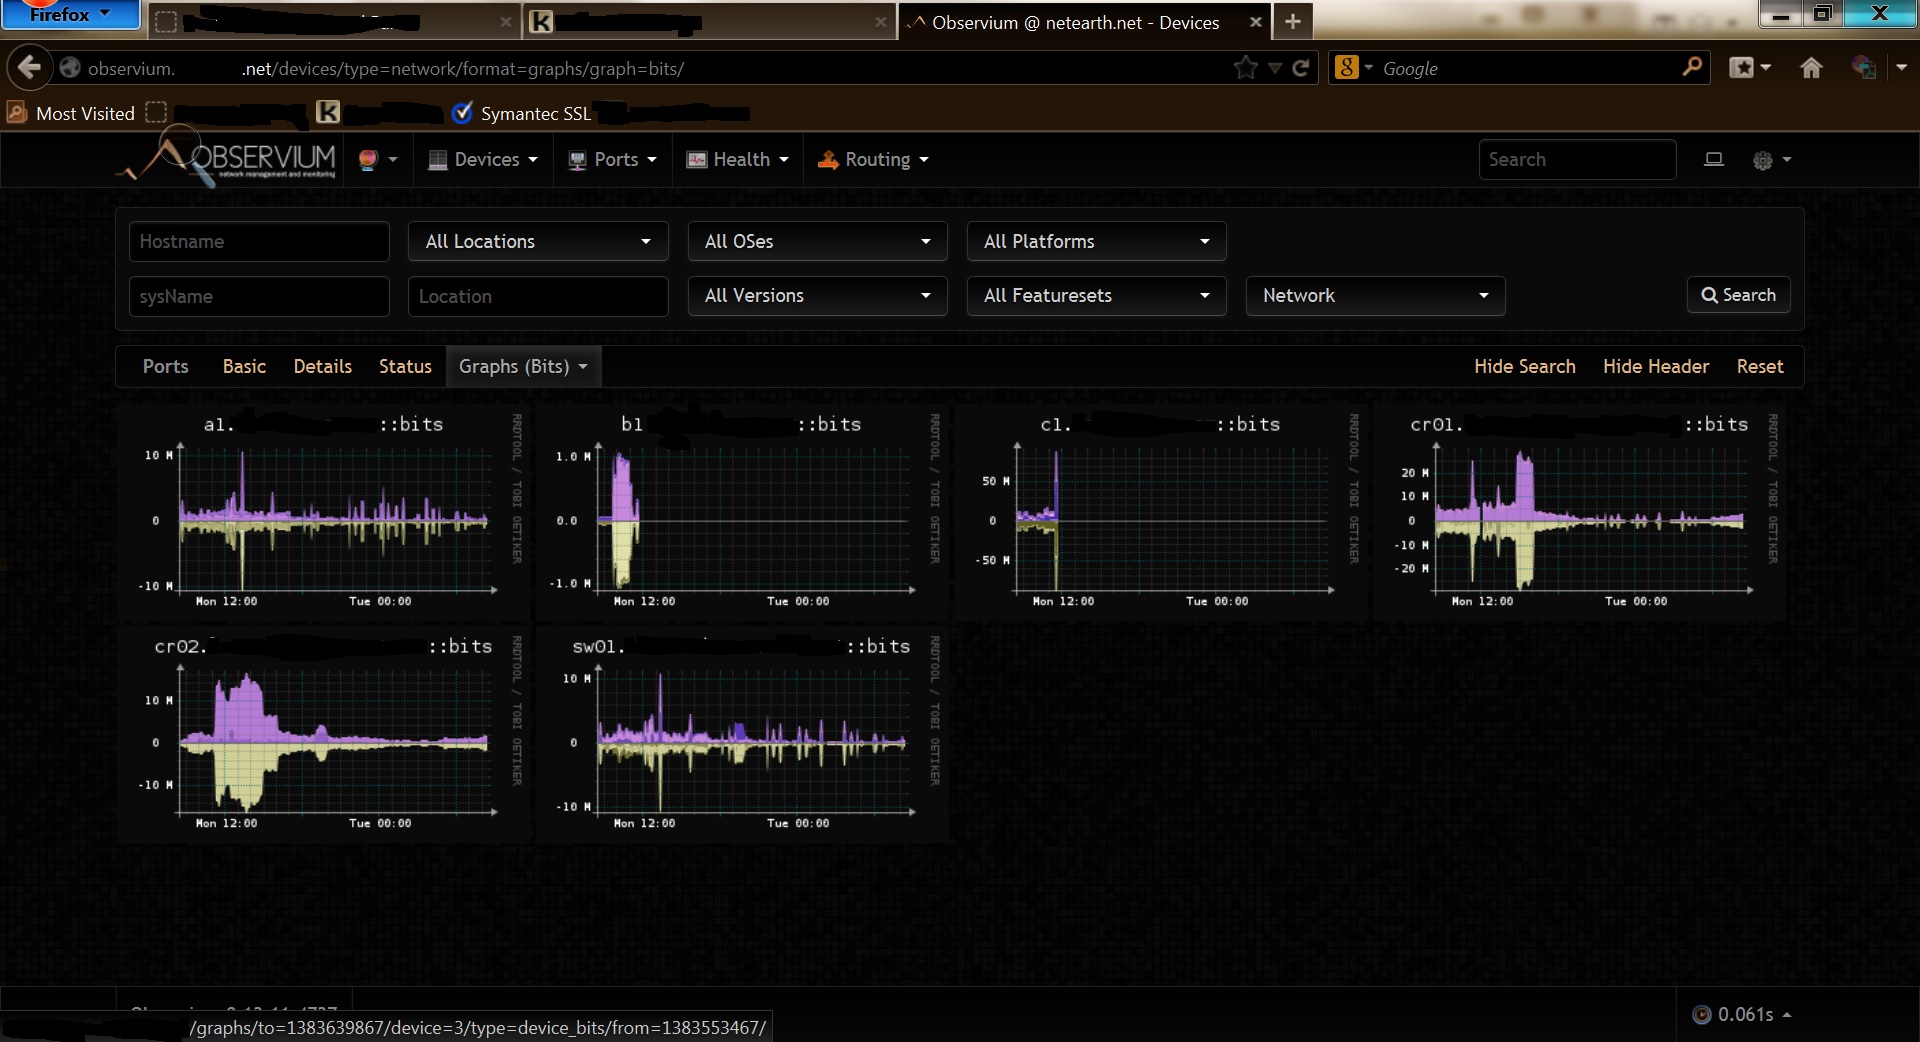
Here is the pic of the networks page. Sorry about the inverted screen, but I am blind as a bat :-)
Kind regards,
Chris
On 05/11/2013 4:00 AM, Mike Stupalov wrote:
that we could help, show:
- Screenshots
- debug poller out:
./poller.php -d -h [your_f_dell] > /tmp/poller.debug (file /tmp/poller.debug send by pastebin or in mail attachment)
On Mon, Nov 4, 2013 at 11:12 PM, Chris Pelling chris@netearth.net wrote:
Hi Guys,
Upgraded today using "svn update" to 4737 from 4760 and 2 switch graphs (dell) stopped showing data, cisco, vyatta and one dell unaffected.
For example, we have 2 x Dell M6220 stacked blades *a and c* and 1 x Dell M6348 stacked blade switch all in M1000e chassis.
a = worked before and after, graph looks aok b = worked before, now stopped c = worked before, now stopped
An interesting observation, if I drill down to a port on B, and click realtime, its showing realtime information - so we know that works. Billing also seems unaffected, just the graphs at : /devices/type=network/format=graphs/graph=bits/ stopped for these 2 devices (albeit one is identical to a working device) exactly at the time of upgrade.
I confirmed we did do the upgrade as per the wiki :
svn update ./discovery.php -h none
So now stumped, what can I do to get them back showing the current data (they have the historical few hours before update) and/or what can I run to aid in finding a poss issue ? :-)
-- Kind regards, Chris
observium mailing list observium@observium.org http://postman.memetic.org/cgi-bin/mailman/listinfo/observium