
1 Mar
2023
1 Mar
'23
2:58 p.m.
Hi.
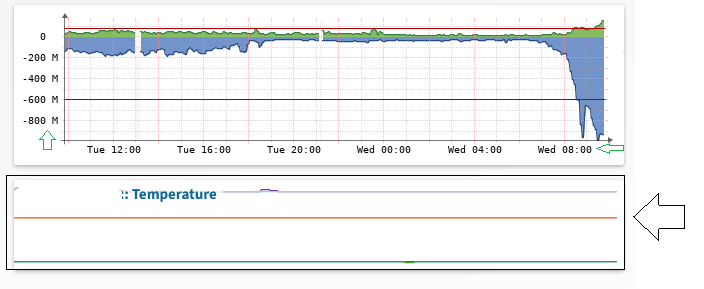
We have 2 graphic on the default dashboard. traffic In/Out on specific interface and temperature on specific device. We must change these graphics, but on new graphic not displays the axis legend...
the black arrow is in the new graph... no axis legend the green arrows is in the old graph... axis legend displayed
[image: image.png] observium: 23.2.12520
--
Saluda cordialmente