
As you can see in the pics
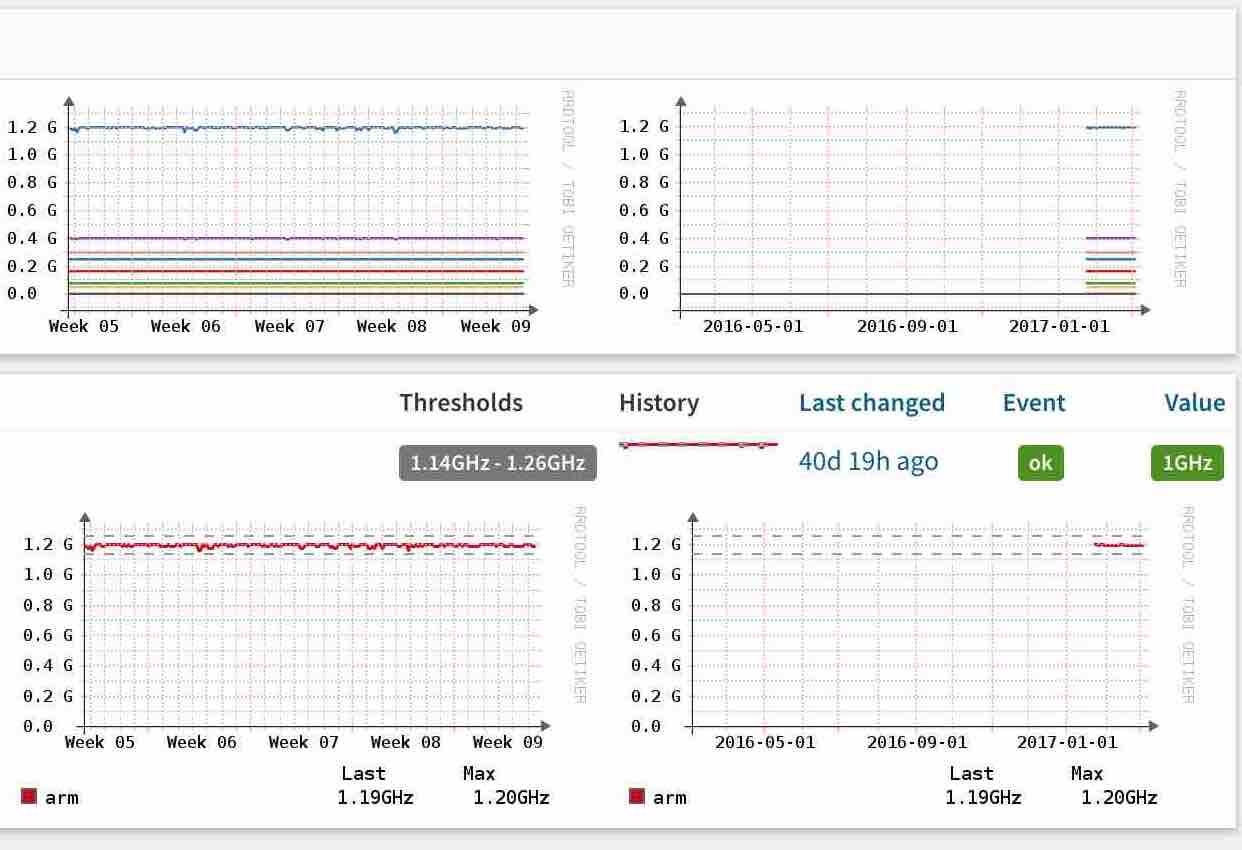
The Values in the table are all showing as 1Ghz but in the graph of the raspberrypi its showing Last value as 1.19Ghz which is not 1Ghz
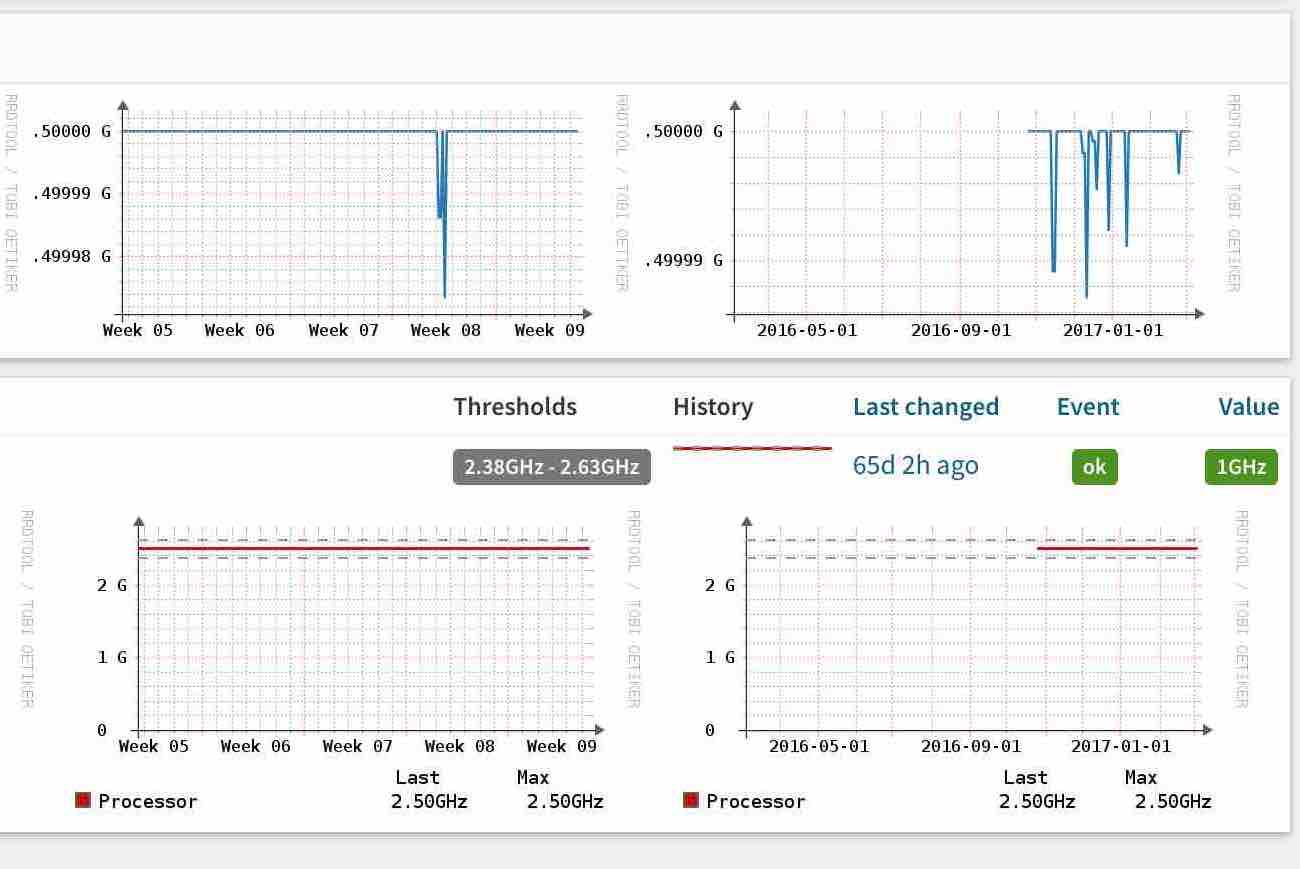
AND in the Mikrotik CHR its showing the Last value as 2.5Ghz which again is MORE than 1Ghz
And even weirder in the graph for the Mikrotik CHR on the weeks view its showing the values down the left as .50000G and not 2.5Ghz
Regards
Simon
On 3 Mar 2017, at 12:49, Markus Klock markus@best-practice.se wrote:
I don't understand, what output do you expect if the frequency is 1Ghz?
/Markus
2017-03-03 13:45 GMT+01:00 Simon Mousey Smith <simonsmith5521@gmail.com mailto:simonsmith5521@gmail.com>: Hi All
Has anybody else got this issue I have with the frequency sections of devices?
if any device frequency is above 1Ghz it isn’t showing the value correctly in the graphs or in the table correctly, they are just showing 1Ghz not like it should
Screenshots showing issue on a mikrotik device and a raspberry pi <frequency.jpg><frequency1.jpg> Regards
Simon
observium mailing list observium@observium.org mailto:observium@observium.org http://postman.memetic.org/cgi-bin/mailman/listinfo/observium http://postman.memetic.org/cgi-bin/mailman/listinfo/observium
observium mailing list observium@observium.org http://postman.memetic.org/cgi-bin/mailman/listinfo/observium