
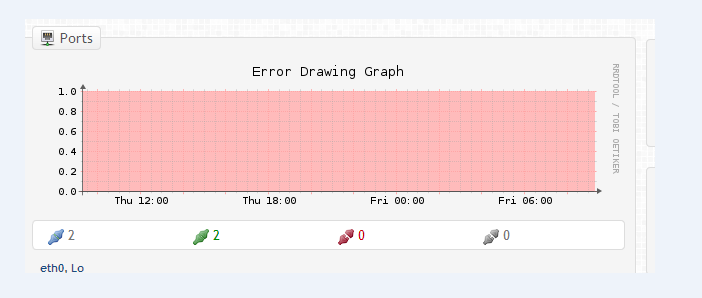
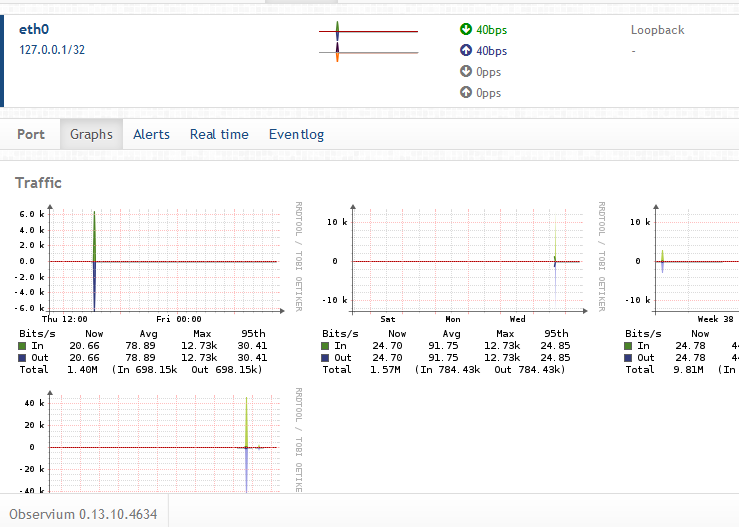
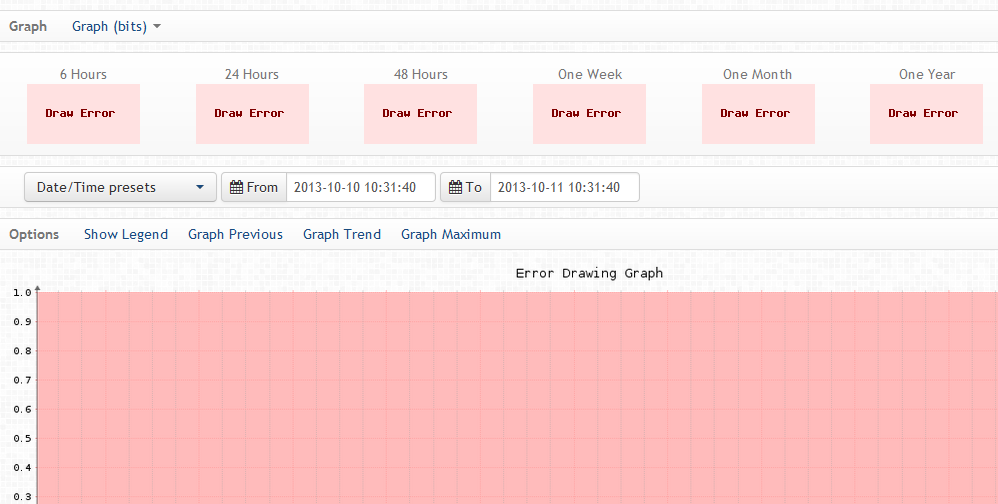
Again, this image is from the Overview Page: [cid:image001.png@01CEC66D.53A832F0] This is one of the two interfaces that you refer: [cid:image002.png@01CEC66D.53A832F0] When I click on the graph from the main overview page, I get this: [cid:image003.png@01CEC66D.53A832F0]
The server that is polling them is in the same rack as the power meters. I hope these images are large enough.
Regards, Ryan Milton MVS Network Manager o: 201-447-1505 x124 c: 862-249-5230 www.mvsusa.comhttp://www.mvsusa.com/ [MVS final logo GOOD very small]
From: observium [mailto:observium-bounces@observium.org] On Behalf Of Tom Laermans Sent: Friday, October 11, 2013 9:31 AM To: Observium Network Observation System Subject: Re: [Observium] Power meter error graphs
Hi,
Why is it obvious they don't have network statistics? Are you polling them through the cloud?
From your bizarrely small screenshot it looks like 2 interfaces are detected though.
Tom
On 10/11/2013 03:20 PM, Ryan Milton wrote: [cid:image005.gif@01CEC66D.53A832F0] I have a number of power meters from tripplite and obviously they don't have network statistics for traffic. So, I get the attached errors for the ports graphs on the overview page and when I click on the ports, where it takes you to the graphs of all the traffic.
I want to be able to disable the display of this, since everything else is correct. Is there an element in code somewhere that I can just comment that out or something?
Regards, Ryan Milton MVS Network Manager o: 201-447-1505 x124 c: 862-249-5230 www.mvsusa.comhttp://www.mvsusa.com/ [MVS final logo GOOD very small]
_______________________________________________
observium mailing list
observium@observium.orgmailto:observium@observium.org
http://postman.memetic.org/cgi-bin/mailman/listinfo/observium