
29 May
2013
29 May
'13
5:58 a.m.
Hi all,
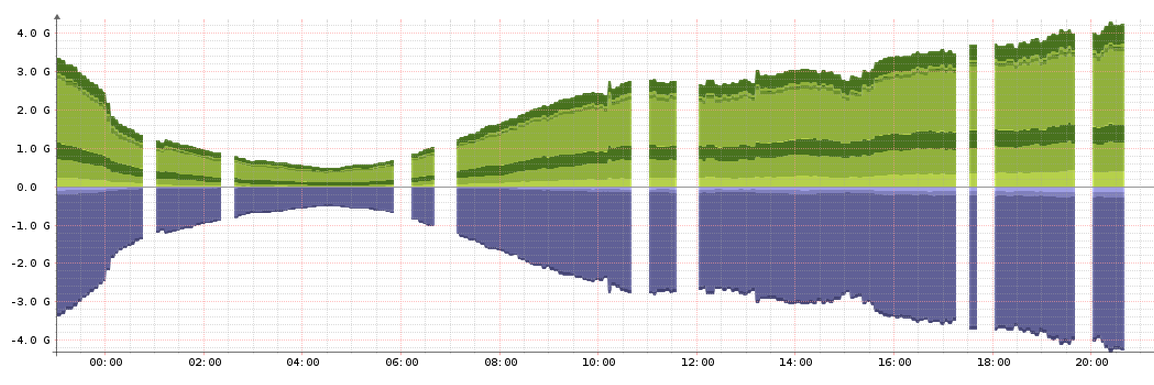
I've been using observium a while ago and since the beginning the tool showed me the graphics like I show you in the attached picture.
There are several "white spaces" marked on the time period (X axis), where the tools is not showing information. I read the FAQs section and I found this advice:
"I'm getting a blank browser window on some pages, but not others", so I incremented the PHP memory parameter from 128M to 384M whithin the php.ini file but this did not work either so I come to you beggin your advice in order to resolve this problem. Besides I have 90 network equipments monitored with the observium application on a virtual server (6 GB of ram and 3 CPUs 3.0 Ghz).
thank you so much for any help
Regards