
Hello! Cisco has big problems with 3650 with severalt bugs with high utilization of CPU and memory-leaks. Unfortunally this problem with CPU isnt seen in Observium. The graph is showing the output from sh cpu platform, stable at 49-50% for example: CPU utilization for five seconds: 48%, one minute: 49%, five minutes: 49% Core 0: CPU utilization for five seconds: 50%, one minute: 49%, five minutes: 49% Core 1: CPU utilization for five seconds: 48%, one minute: 51%, five minutes: 49% Core 2: CPU utilization for five seconds: 47%, one minute: 47%, five minutes: 49% Core 3: CPU utilization for five seconds: 49%, one minute: 48%, five minutes: 49%
In the meantime we have extreamly high cpu sh processes cpu CPU utilization for five seconds: 95%/29%; one minute: 96%; five minutes: 96% The High cpu causes at least that the device is alerting as down since it cant answer snmp-polling.
Is this fixable so we can get alerts from high CPU?
Regards Fredrik Svensson
Från: observium [mailto:observium-bounces@observium.org] För Laszlo Nemeth via observium Skickat: den 18 september 2019 14:34 Till: Observium observium@observium.org Kopia: Laszlo Nemeth lnemeth@emarsys.com Ämne: [Observium] dashboard - alert status widget slider missed
Hello
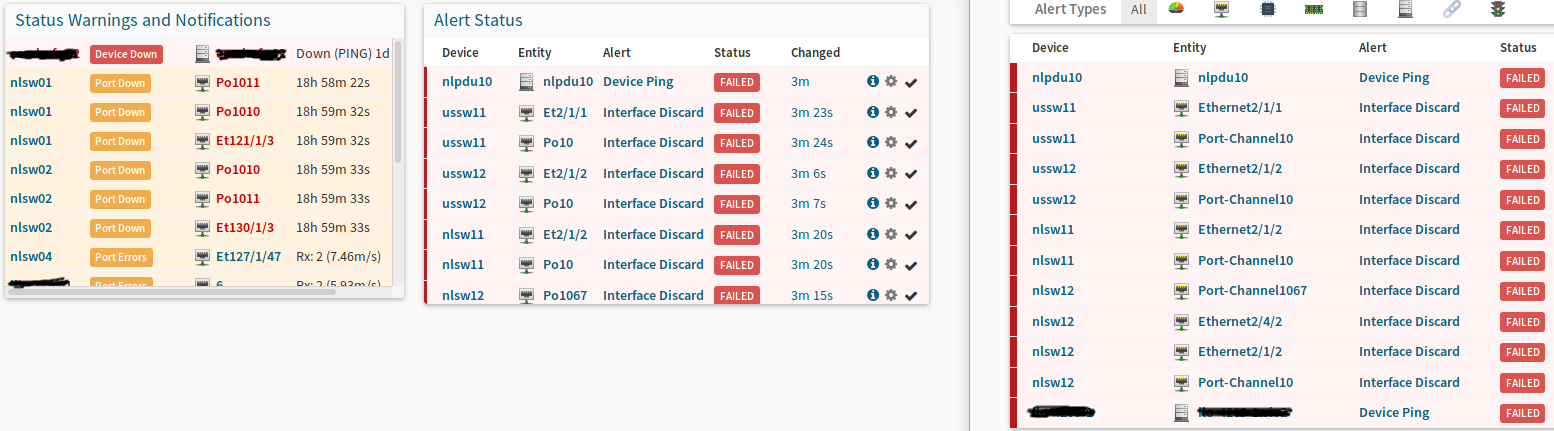
In the latest version (r10023 - but may be it was never worked) the Alert status widget does not contain slider on the right side if the alerts are more than it fit to the widget's size. Added a picture where You can see the slider is present in the right side of the Status warning widget but missed in the Alert Status widget. The right table shows that there are more alerts than shows the widget. I use Firefox 69.0.
[cid:image001.png@01D56EC2.9ADB1EE0]
Thanks
Laszlo