
I have been using observium for few months now. I wanted some info from the graphs that observium spins off.
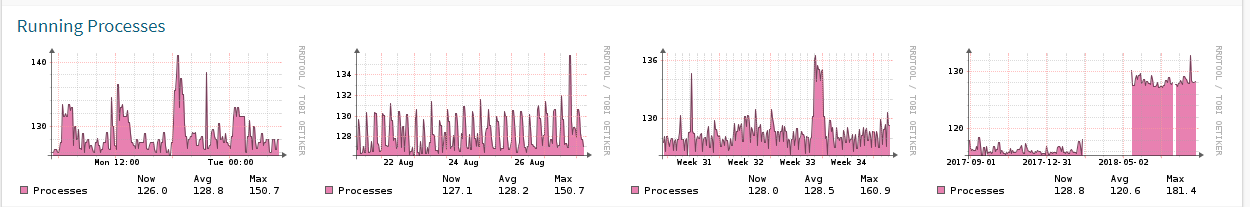
Following is the graphs for running process consumption:
[cid:image001.png@01D43EAC.03C3D610]
Can I get something like top 10 process graphs?
Let me give you an example, I sometimes get requests from folks asking, "Ok my memory utilization on a server ABC was 90% on this particular day. Can we get list of processes consuming high memory on that particular day ? "
So as per this, can I customize the graph to get process level info ?
Kaustubh Parthasarthy Analyst, Production Management Group D +91 20 6646 8625 | M +91 989 284 4625 | T +91 20 6646 8888 4/F, C-Wing, Panchshil Tech Park-1, Yerawada, Pune 411006, India
[:1. Social Media Icons:CLSA_Social Media Icons_linkedin.png]https://hk.linkedin.com/company/clsa[:1. Social Media Icons:CLSA_Social Media Icons_twitter.png]https://twitter.com/clsainsights?lang=en[:1. Social Media Icons:CLSA_Social Media Icons_youtube.png]https://www.youtube.com/channel/UC0qWp_lLnOcRYmBlCNQgZKA[:1. Social Media Icons:CLSA_Social Media Icons_facebook.png]https://www.facebook.com/clsacommunity/
clsa.comhttps://www.clsa.com/ Insights. Liquidity. Capital.
[CLSA_RGB]https://www.clsa.com/member
A CITIC Securities Company
The content of this communication is intended for the recipient and is subject to CLSA Legal and Regulatory Notices. These can be viewed at https://www.clsa.com/disclaimer.html or sent to you upon request. Please consider before printing. CLSA is ISO14001 certified and committed to reducing its impact on the environment.