
Problem was caused by mysql
[ERROR] /usr/sbin/mysqld: The table 'ports-state' is full
[ERROR] /usr/sbin/mysqld: The table 'entPhysical-state' is full
After fixing this, everything is fine.
From: observium [mailto:observium-bounces@observium.org] On Behalf Of Gregory Storme Sent: dinsdag 11 maart 2014 13:34 To: observium@observium.org Subject: [Observium] traffic 0bps / 0pps
Hi,
I'm running Observium 0.14.3.5094 on Debian 7, followed the installation guide.
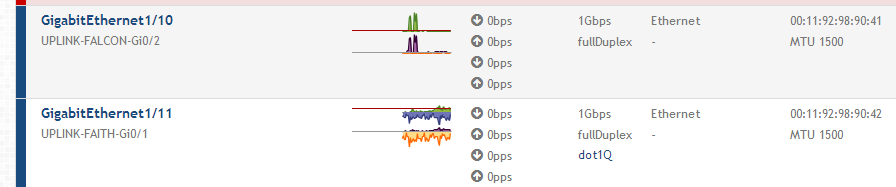
The problem is that the traffic, displayed under the ports overview, is 0bps / 0pps.
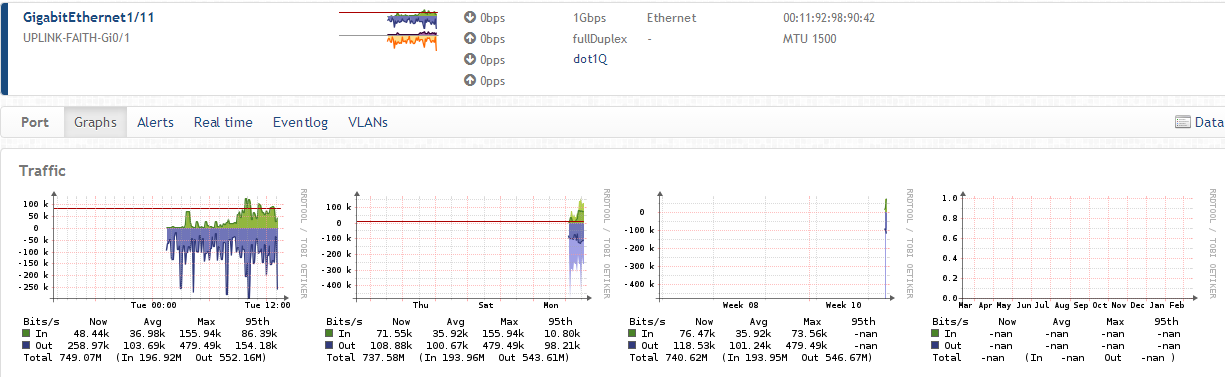
When hovering over that port, or clicking on it, the graphs do display the traffic correctly.
Some devices their ports do display the traffic number as well, but the majority doesn't.
I can't figure out why the traffic on some ports is displayed correct, while it's not on all the others.
I don't think it's not a problem on the devices being polled, because I'm running 2 observium versions for testing purposes (0.13.10.4585 & 0.14.3.5094), and on v13 the traffic for device X is displayed correctly, while on v14 the traffic for that device is 0bps/0pps on all ports (graphs work fine). And the other way around for device Y.
These are Cisco and Juniper devices being polled. All the graphs work fine.
I have attached these screenshots to clarify what I mean:
The port graphs: