
hello !
/opt/observium/discovery.php -h ny2asr01 -m sensors –d
___ _ _ / _ \ | |__ ___ ___ _ __ __ __(_) _ _ _ __ ___ | | | || '_ \ / __| / _ | '__|\ \ / /| || | | || '_ ` _ \ | |_| || |_) |__ | __/| | \ V / | || |_| || | | | | | ___/ |_.__/ |___/ ___||_| _/ |_| __,_||_| |_| |_| Observium Professional 19.7.9962 http://www.observium.org
##### Starting discovery run at 2019-07-26 06:47:33 #####
##### ny2asr01 [362] #####
o OS Type iosxr o OS Group cisco o SNMP Version v3 o Last discovery 2019-07-26 05:51:22 o Last duration 81.58 seconds
##### Module Start: sensors #####
o CISCO-ENTITY-SENSOR-MIB o CISCO-ENVMON-MIB Fans o CISCO-ENTITY-FRU-CONTROL-MIB o CISCO-POWER-ETHERNET-EXT-MIB o POWER-ETHERNET-MIB o ENTITY-SENSOR-MIB o CISCO-RF-MIB cRFCfgRedundancyOperMode [!]cRFStatusUnitState [!]cRFStatusPeerUnitState [!]
o Duration 7.6648s
##### ny2asr01 [362] completed discovery modules at 2019-07-26 06:47:41 #####
o Discovery time 7.6735 seconds
##### Finished discovery run at 2019-07-26 06:47:41 #####
o Devices Discovered 1 o Discovery Time 7.939 secs o Memory usage 14MB (peak: 14MB) o MySQL Usage Cell[1/0s] Row[5/0.001s] Rows[36/0.009s] Column[1/0s] Update[1/0.004s] Insert[1/0.003s] Delete[2/0.011s] o RRDTool Usage
show controllers tenGigE 0/0/2/3 Fri Jul 26 08:48:44.162 Summer Operational data for interface TenGigE0/0/2/3:
State: Administrative state: enabled Operational state: Up LED state: Green On
Phy: Media type: R fiber over 1310nm optics Optics: Vendor: CISCO-SUMITOMO Part number: SPP5200LR-C6 Serial number: SPC1820003Z
MAC address information: Operational address: 70e4.2234.93a8 Burnt-in address: 70e4.2232.f5a3 No unicast addresses in filter No multicast addresses in filter
Autonegotiation disabled.
Operational values: Speed: 10Gbps Duplex: Full Duplex Flowcontrol: Bidirectional Loopback: None (or external) MTU: 15808 MRU: 15808 Inter-packet gap: standard (12)
On Thu, Jul 25, 2019 at 6:23 PM Klimek, Denis < DKlimek@stadtwerke-norderstedt.de> wrote:
A discovery debug would be also nice
./discovery.php –h <id> -m sensors –d
Maybe it’s caused by 3rd party but until 6.5.3 IOS-XR they should be readable even if it’s not original.
Since 6.5.3 they must have correct Cisco Profile Branding.
Can you read it trough CLI? “show controller Te….”
Mit freundlichem Gruß
Stadtwerke Norderstedt
*Denis Klimek*
Professional Network Engineer
IP-Systemtechnik
Tel: 040 / 521 04 – 1049
Mobil: 0151 / 652 219 06
dklimek@stadtwerke-norderstedt.de
www.stadtwerke-norderstedt.de
*Von:* Edvinas Kairys [mailto:edvinas.email@gmail.com] *Gesendet:* Donnerstag, 25. Juli 2019 16:48 *An:* Klimek, Denis *Cc:* Observium *Betreff:* Re: [Observium] Question about health graphs on IOS-XR
Optics are third party:
NAME: "module mau 0/0/2/3", DESCR: "10GBASE-LR SFP+ Module for SMF" PID: SFP-10G-LR , VID: V02 , SN: SPC1820003Z
show version Cisco IOS XR Software, Version 5.1.3[Default] Copyright (c) 2015 by Cisco Systems, Inc.
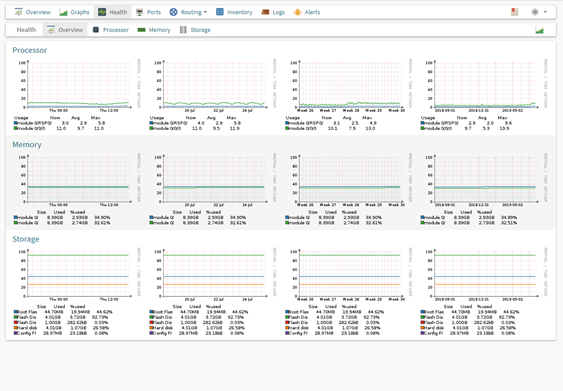
Scrreen shot:
[image: image.png]
On Thu, Jul 25, 2019 at 5:42 PM Klimek, Denis < DKlimek@stadtwerke-norderstedt.de> wrote:
Hi Edvinas,
We have IOS-XR devices aswell and we are able to see those. Share some more information and/or screenshots.
Version of IOS-XR, original optics or 3rd party?
Mit freundlichem Gruß
Stadtwerke Norderstedt
*Denis Klimek*
Professional Network Engineer
IP-Systemtechnik
Tel: 040 / 521 04 – 1049
Mobil: 0151 / 652 219 06
dklimek@stadtwerke-norderstedt.de
www.stadtwerke-norderstedt.de
*Von:* observium [mailto:observium-bounces@observium.org] *Im Auftrag von *Edvinas Kairys via observium *Gesendet:* Donnerstag, 25. Juli 2019 16:32 *An:* Observium *Cc:* Edvinas Kairys *Betreff:* [Observium] Question about health graphs on IOS-XR
Hello,
Is there any reason why Observium doesnt show SFP db levels graphs on IOS-XR devices ?
Thank you