
Adam, Actually the map is not my issue right now, that was my issue last time. The advice last time worked. Now I am having an issue that despite adding several ports to be graphed, i only get one. I thought i submitted my request on this to the newsgroup, whcih usually garners a quick reply, but now Im not certain as no one has even asked for clarification on my question. Ill go double check that, in the mean time, maybe you can help me?
here is the snippet from my config.php -----------------------------------------------------
// Device status settings // Show the status messages you want $config['frontpage']['device_status']['max']['interval'] = 24; // Maximal interval for which to display devices status (in hours) $config['frontpage']['device_status']['max']['count'] = 200; $config['frontpage']['device_status']['uptime'] = true; $config['frontpage']['device_status']['devices'] = true; // Show the down devices $config['frontpage']['device_status']['ports'] = true; // Show the down ports $config['frontpage']['device_status']['links'] = true; // Show the down inter-device links (with CDP/LLDP linked devices) $config['frontpage']['device_status']['errors'] = true; // Show the ports with interface errors/ $config['frontpage']['device_status']['services'] = true;
// Custom traffic graphs $config['frontpage']['custom_traffic']['ids'] = "3697"; // COMMA SEPARATED PORT ID FOR EXAMPLE: "1,2,3,4,5" $config['frontpage']['custom_traffic']['title'] = "Traffic"; // Your own title for the custom traffic graphs
// Custom mini graphs $config['frontpage']['minigraphs']['ids'] = "51,device_processor,CPU"; // Comma and semicolon separated array list, first the device id or graph id followed by the image type and the text header you want (example: "2,$ $config['frontpage']['minigraphs']['legend'] = false; // Enable/Disable the legend on custom mini graph view $config['frontpage']['minigraphs']['title'] = "Mini Graphs Overview";
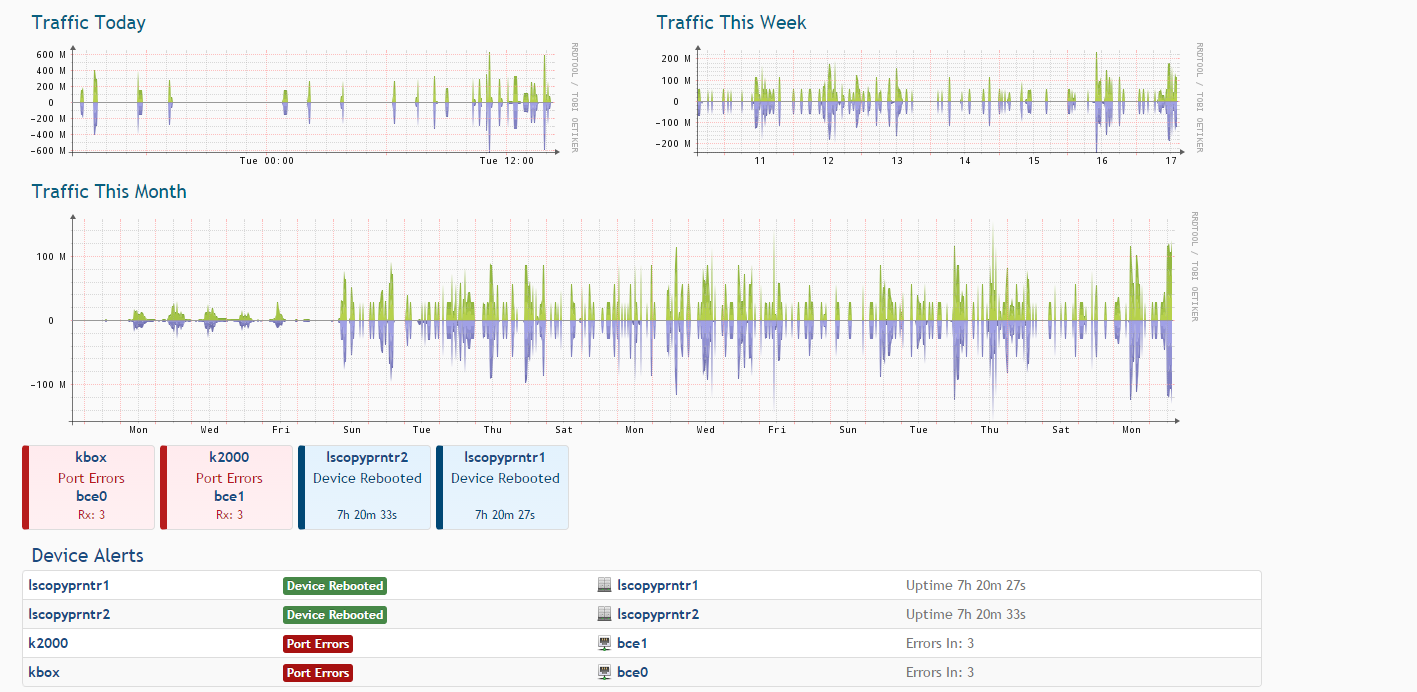
-------------------------------------------------- Based on that config I would expect graphs for 4 ports, showing 24 hour time periods on each, and a mini graph underneath showing CPU usage on that device (its a fortinet firewall) Instead I see this:
[image: Inline image 1] Traffic graphs for one port, three timescales and no CPU.
What did I do wrong? version 0.15.11.7197
Joshua Bierman Director of Technology Yeshivat Noam 201-261-1919 x136
On Tue, Nov 17, 2015 at 3:45 PM, Adam Armstrong adama@memetic.org wrote:
Hi Josh,
Removing the map is as simple as removing the 'map' entry from the array. Here are some examples from my development install's config :
$config['frontpage']['order'] = array('status_summary', 'overall_traffic', 'map', 'alert_table', 'device_status_boxes', 'eventlog'); $config['frontpage']['order'] = array('status_summary', 'map', 'device_status_boxes', 'device_status', 'eventlog'); $config['frontpage']['order'] = array('status_summary', 'map', 'alert_status_boxes', 'alert_status', 'eventlog');
We could probably do with some better documentation on this stuff...
adam.
On 17/11/2015 19:16:03, Josh Bierman jbierman@yeshivatnoam.org wrote: Martin, i changed my machine around and went looking for the defaults.inc to use as a guide again and its no longer there (by the way, im now a paying customer because I felt the product was worth the cash, you guy shave built something awesome here.....I just need a bit of direction) Thanks,
Joshua Bierman Director of Technology Yeshivat Noam 201-261-1919 x136
On Thu, May 8, 2014 at 3:51 PM, Martin Smith < Martin.Smith@netgainhosting.com> wrote:
Joshua,
The wiki seems to always be slightly behind. Check the defaults.inc for up-to-date options.
http://www.observium.org/svn/observer/trunk/includes/defaults.inc.php
Below should be what you are looking for. Replace “map” with “custom_traffic” or “minigraphs”. Then be sure to define what appears in that section (see the corresponding documentation)
// Frontpage order you can use: status_summary, map, device_status_boxes, overall_traffic, custom_traffic, minigraphs, syslog, eventlog
*$config['frontpage']['order'] = array('status_summary', ' **custom_traffic ', 'device_status_boxes', 'device_status', 'eventlog');*
Regards,
*Martin Smith **|* *Network Analyst **|* *Netgain*720 West Saint Germain Street | St. Cloud | MN | 56301
Phone: 320-257-6607 *|* 877.797.4700 x170
*From:* observium [mailto:observium-bounces@observium.org] *On Behalf Of *Josh Bierman *Sent:* Thursday, May 08, 2014 12:18 PM *To:* observium@observium.org *Subject:* [Observium] front page editing
Hello All,
I want to keep the default layout of the front page with one change: replace the map with a traffic graph. When I tried this using the [frontpage][order] line (removed map from order and put in a custom graph, included EVERYTHING else) , the "Devices,Ports,Sensors" table at the top diapered. How do i get it back?
Even if the answer is as simple as RTFM-pages #-## that would help.
Thanks,
Joshua Bierman Director of Technology Yeshivat Noam
observium mailing list observium@observium.org http://postman.memetic.org/cgi-bin/mailman/listinfo/observium
_______________________________________________ observium mailing list observium@observium.org http://postman.memetic.org/cgi-bin/mailman/listinfo/observium
observium mailing list observium@observium.org http://postman.memetic.org/cgi-bin/mailman/listinfo/observium