
Hi Kaustubh, the short answer is no. You can not modify Observium to get you a list of processes. The reason is that Observium monitor other servers via the SNMP-protocol. Observium can only gather information that the servers chose to expose via SNMP. The amount of running processes is gathered by the server and exposed via SNMP so that Observium can draw the above graph. Which processes are running and are using the most resources are simply not show over SNMP and would be close to impossible to add.
I would instead recommend that you take a look at the Observium UNIX-agent(if the servers you want to monitor runs linux/BSD) It could probably gather this info for you and send the information to Observium but I do not think this function exists yet. But if you would like to add it then the UNIX-agent is the place to do it
/Markus
Den ons 29 aug. 2018 kl 09:31 skrev Kaustubh Parthasarthy, CLSA < kaustubh.parthasarthy@clsa.com>:
I will give my use case again.
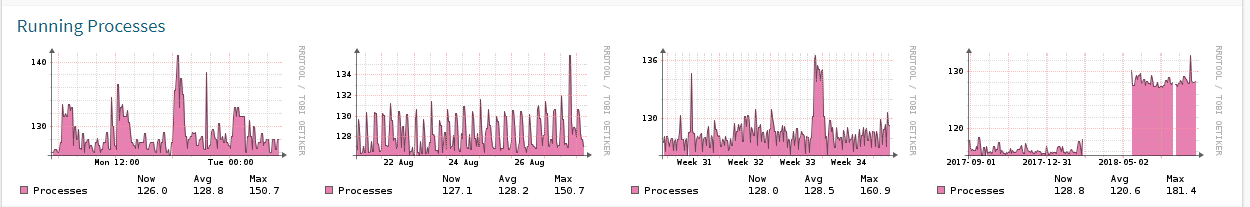
Following is the graphs for running process consumption:
[image: cid:image001.png@01D43EAC.03C3D610]
But this graph does not show me what processes are consuming the load like lets say “java” process or something on the graph.
Let me give you an example, I sometimes get requests from folks asking, “*Ok my memory utilization on a server ABC was 90% on this particular day. Can we get list of processes consuming high memory on that particular day ? * “
So as per this, can I customize the graph to get process level info ?
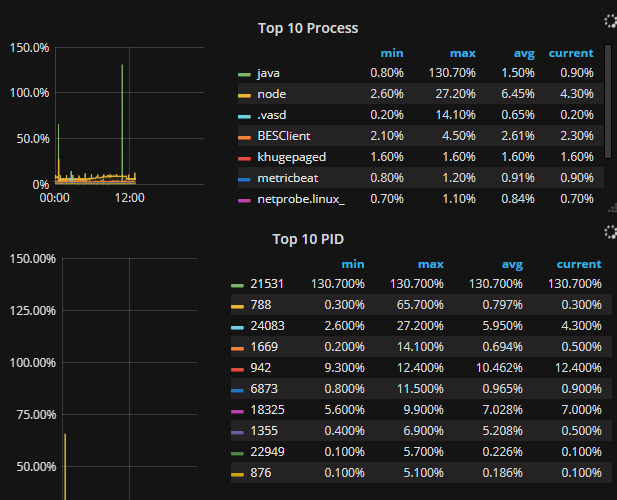
Example below is an graph which is giving top 10 processes consuming the cpu/memory utilization or the top 10 Process ID:
[image: cid:image002.png@01D43F98.507BB350]
Hence wanted to know can I customize observium graphs to display something like the above screenshot (Obviously look and feel will change) but to get the top process consumption data.
Regards
Kaustubh
*From:* Kaustubh Parthasarthy, CLSA *Sent:* Wednesday, August 29, 2018 12:55 PM *To:* 'Mike Stupalov'; Observium *Subject:* RE: [Observium] Get more information on Dashboard for Process consumption
Why does this not make sense? I already gave my use case when I first asked this querry:
Comments as below:
I have been using observium for few months now. I wanted some info from the graphs that observium spins off.
Following is the graphs for running process consumption:
[image: cid:image001.png@01D43EAC.03C3D610]
Can I get something like top 10 process graphs?
Let me give you an example, I sometimes get requests from folks asking, “*Ok my memory utilization on a server ABC was 90% on this particular day. Can we get list of processes consuming high memory on that particular day ? * “
So as per this, can I customize the graph to get process level info ?
Regards
Kaustubh
*From:* Mike Stupalov [mailto:mike@stupalov.ru] *On Behalf Of *Mike Stupalov *Sent:* Wednesday, August 29, 2018 12:53 PM *To:* Observium; Kaustubh Parthasarthy, CLSA *Subject:* Re: [Observium] Get more information on Dashboard for Process consumption
What you mean as "process level".. CPU load?
This is impossible (and it makes no sense), because here is checked if poller process already launched. And records information about the process just created (when there is still no load in it).
Kaustubh Parthasarthy, CLSA kaustubh.parthasarthy@clsa.com
29 August 2018 at 10:01
I am trying to get the process level information through observium.
Hence I am trying to leverage the script or if there is anything else you guys can assist me or guide me to.
Regards
Kaustubh
*From:* observium [mailto:observium-bounces@observium.org observium-bounces@observium.org] *On Behalf Of *Markus Klock *Sent:* Wednesday, August 29, 2018 12:29 PM *To:* Observium Network Observation System *Subject:* Re: [Observium] Get more information on Dashboard for Process consumption
What exactly is it that you are trying to accomplish here?
/Markus
Den ons 29 aug. 2018 kl 07:04 skrev Kaustubh Parthasarthy, CLSA < kaustubh.parthasarthy@clsa.com>:
The content of this communication is intended for the recipient and is subject to CLSA Legal and Regulatory Notices. These can be viewed at https://www.clsa.com/disclaimer.html or sent to you upon request. Please consider before printing. CLSA is ISO14001 certified and committed to reducing its impact on the environment.
observium mailing list observium@observium.org http://postman.memetic.org/cgi-bin/mailman/listinfo/observium
Markus Klock markus@best-practice.se
29 August 2018 at 09:59
What exactly is it that you are trying to accomplish here?
/Markus
observium mailing list observium@observium.org http://postman.memetic.org/cgi-bin/mailman/listinfo/observium
Kaustubh Parthasarthy, CLSA kaustubh.parthasarthy@clsa.com
29 August 2018 at 08:04
# write into db current process info
p_query = """INSERT INTO `observium_processes` (`process_pid`,`process_ppid`,`process_name`,`process_uid`,`process_command`,`process_start`,`device_id`)
VALUES (%s,%s,%s,%s,%s,%s,'0')"""try:
cursor.execute(p_query, (pid,ppid,scriptname,uid,command,s_time))
process_id = db.insert_id()
db.commit()
except:
pass
Can I leverage the above for process level info ?
Regards
Kaustubh
*From:* Kaustubh Parthasarthy, CLSA *Sent:* Wednesday, August 29, 2018 10:32 AM *To:* observium@observium.org *Subject:* RE: [Observium] Get more information on Dashboard for Process consumption
I found the poller-wrapper.py script
Was thinking if I can do some customization on this script. Can you experts please suggest something
Regards
Kaustubh
*From:* observium [mailto:observium-bounces@observium.org observium-bounces@observium.org] *On Behalf Of *Adam Armstrong *Sent:* Wednesday, August 29, 2018 9:14 AM *To:* observium@observium.org *Subject:* Re: [Observium] Get more information on Dashboard for Process consumption
There is no script. These are counters pulled from either HOST-RESOURCES-MIB or UCD-MIB via SNMP.
adam.
The content of this communication is intended for the recipient and is subject to CLSA Legal and Regulatory Notices. These can be viewed at https://www.clsa.com/disclaimer.html or sent to you upon request. Please consider before printing. CLSA is ISO14001 certified and committed to reducing its impact on the environment.
observium mailing list observium@observium.org http://postman.memetic.org/cgi-bin/mailman/listinfo/observium
Adam Armstrong adama@memetic.org
29 August 2018 at 06:43
There is no script. These are counters pulled from either HOST-RESOURCES-MIB or UCD-MIB via SNMP.
adam.
observium mailing list observium@observium.org http://postman.memetic.org/cgi-bin/mailman/listinfo/observium
Kaustubh Parthasarthy, CLSA kaustubh.parthasarthy@clsa.com
29 August 2018 at 06:09
Ok,
Can you let me know what script observium uses to pull the performance data ? There has to be script which is running on the system correct.
Regards
Kaustubh
*From:* observium [mailto:observium-bounces@observium.org observium-bounces@observium.org] *On Behalf Of *Adam Armstrong *Sent:* Tuesday, August 28, 2018 6:45 PM *To:* observium@observium.org *Subject:* Re: [Observium] Get more information on Dashboard for Process consumption
Hi,
We don't currently collect per-process statistics.
adam.
The content of this communication is intended for the recipient and is subject to CLSA Legal and Regulatory Notices. These can be viewed at https://www.clsa.com/disclaimer.html or sent to you upon request. Please consider before printing. CLSA is ISO14001 certified and committed to reducing its impact on the environment.
observium mailing list observium@observium.org http://postman.memetic.org/cgi-bin/mailman/listinfo/observium
-- Mike Stupalov Observium Limited, http://observium.org
The content of this communication is intended for the recipient and is subject to CLSA Legal and Regulatory Notices. These can be viewed at https://www.clsa.com/disclaimer.html or sent to you upon request. Please consider before printing. CLSA is ISO14001 certified and committed to reducing its impact on the environment. _______________________________________________ observium mailing list observium@observium.org http://postman.memetic.org/cgi-bin/mailman/listinfo/observium