Incorrect memory graph for large RAM amount

Hi,
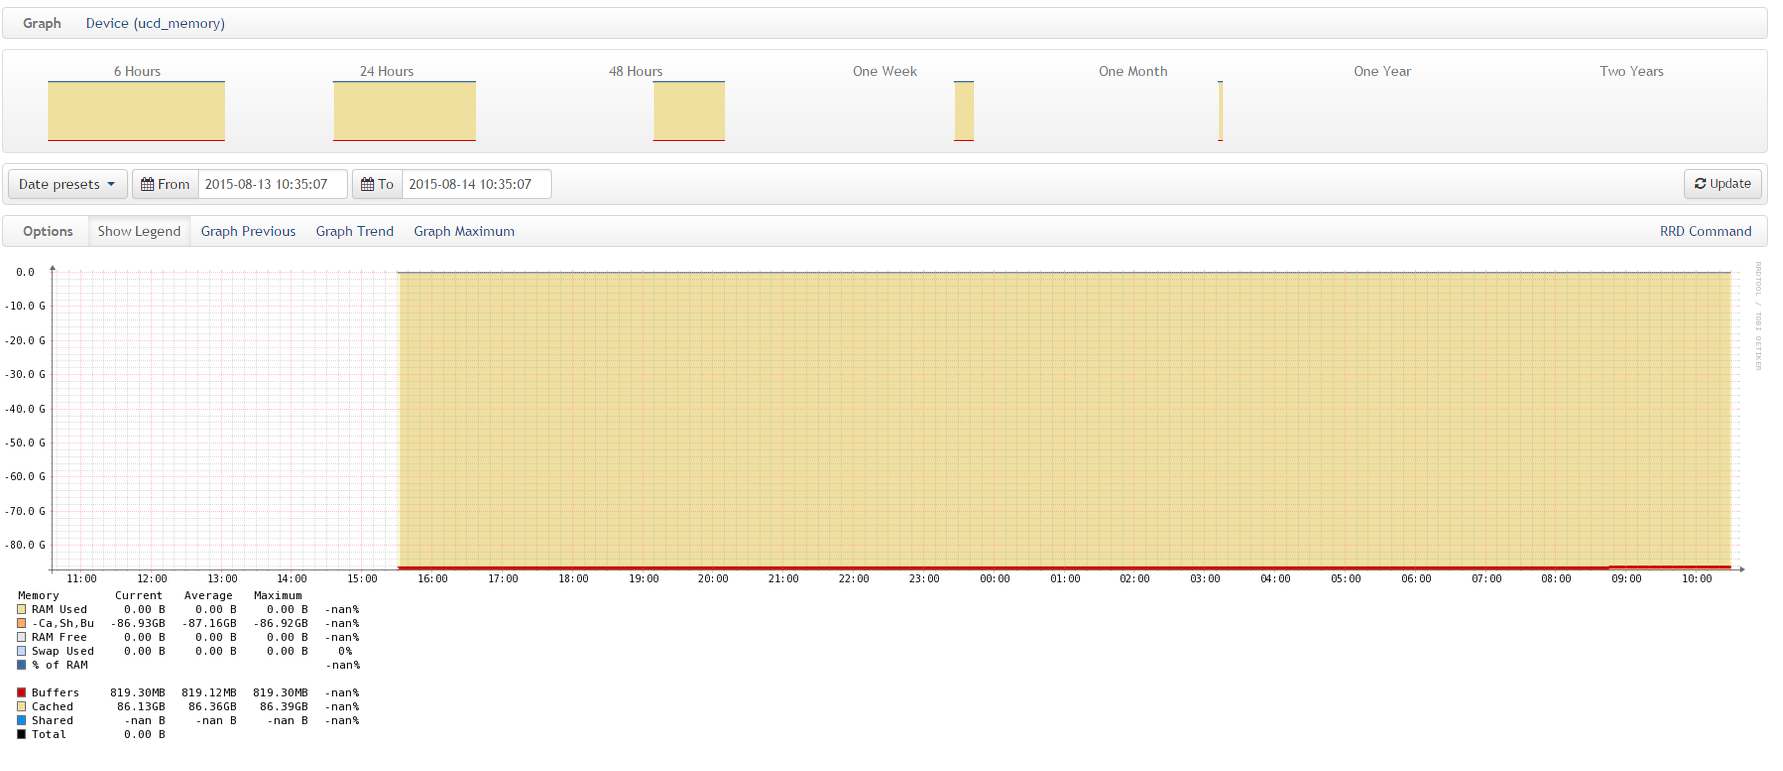
Just discovered a weirdness when I added a server that has 3TB of RAM : the ucd_memory graph is totally messed up. It only displays negative amount of Cache/Shared buffers.
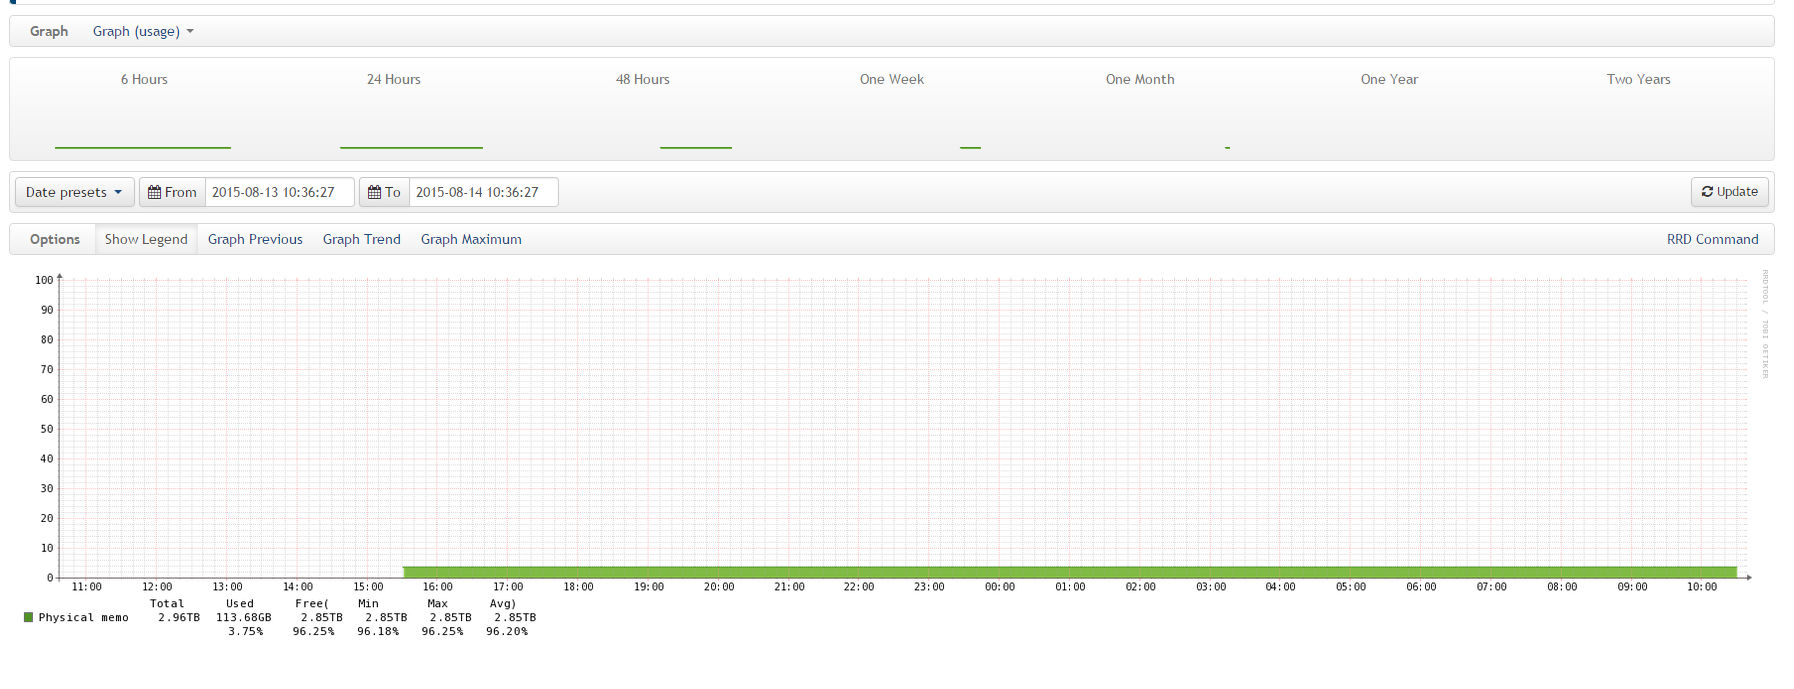
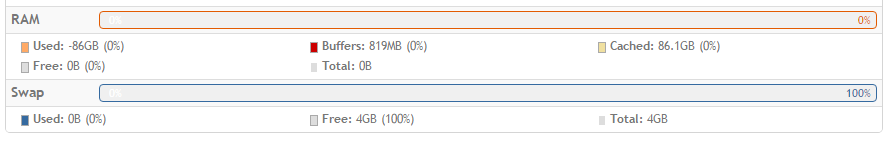
The legend shows that it didn't handle the 3TB correctly. But it seems to be fine for the health/memory view where the correct amount is displayed everywhere.
I have attached the debug output of the poller for this device. Best regards, Louis

This is probably caused by the counters used by the detailed graph not correctly handling the very large numbers.
These values come from UCD-MIB, quite old and probably not designed for huge values.
Adam.
Sent with AquaMail for Android http://www.aqua-mail.com
On 14 August 2015 11:04:20 am "Louis Bailleul" louis.bailleul@phangos.fr wrote:
Hi,
Just discovered a weirdness when I added a server that has 3TB of RAM : the ucd_memory graph is totally messed up. It only displays negative amount of Cache/Shared buffers.
The legend shows that it didn't handle the 3TB correctly. But it seems to be fine for the health/memory view where the correct amount is displayed everywhere.
I have attached the debug output of the poller for this device. Best regards, Louis
observium mailing list observium@observium.org http://postman.memetic.org/cgi-bin/mailman/listinfo/observium
participants (2)
-
 Adam Armstrong
 -
 Louis Bailleul