
Hi,
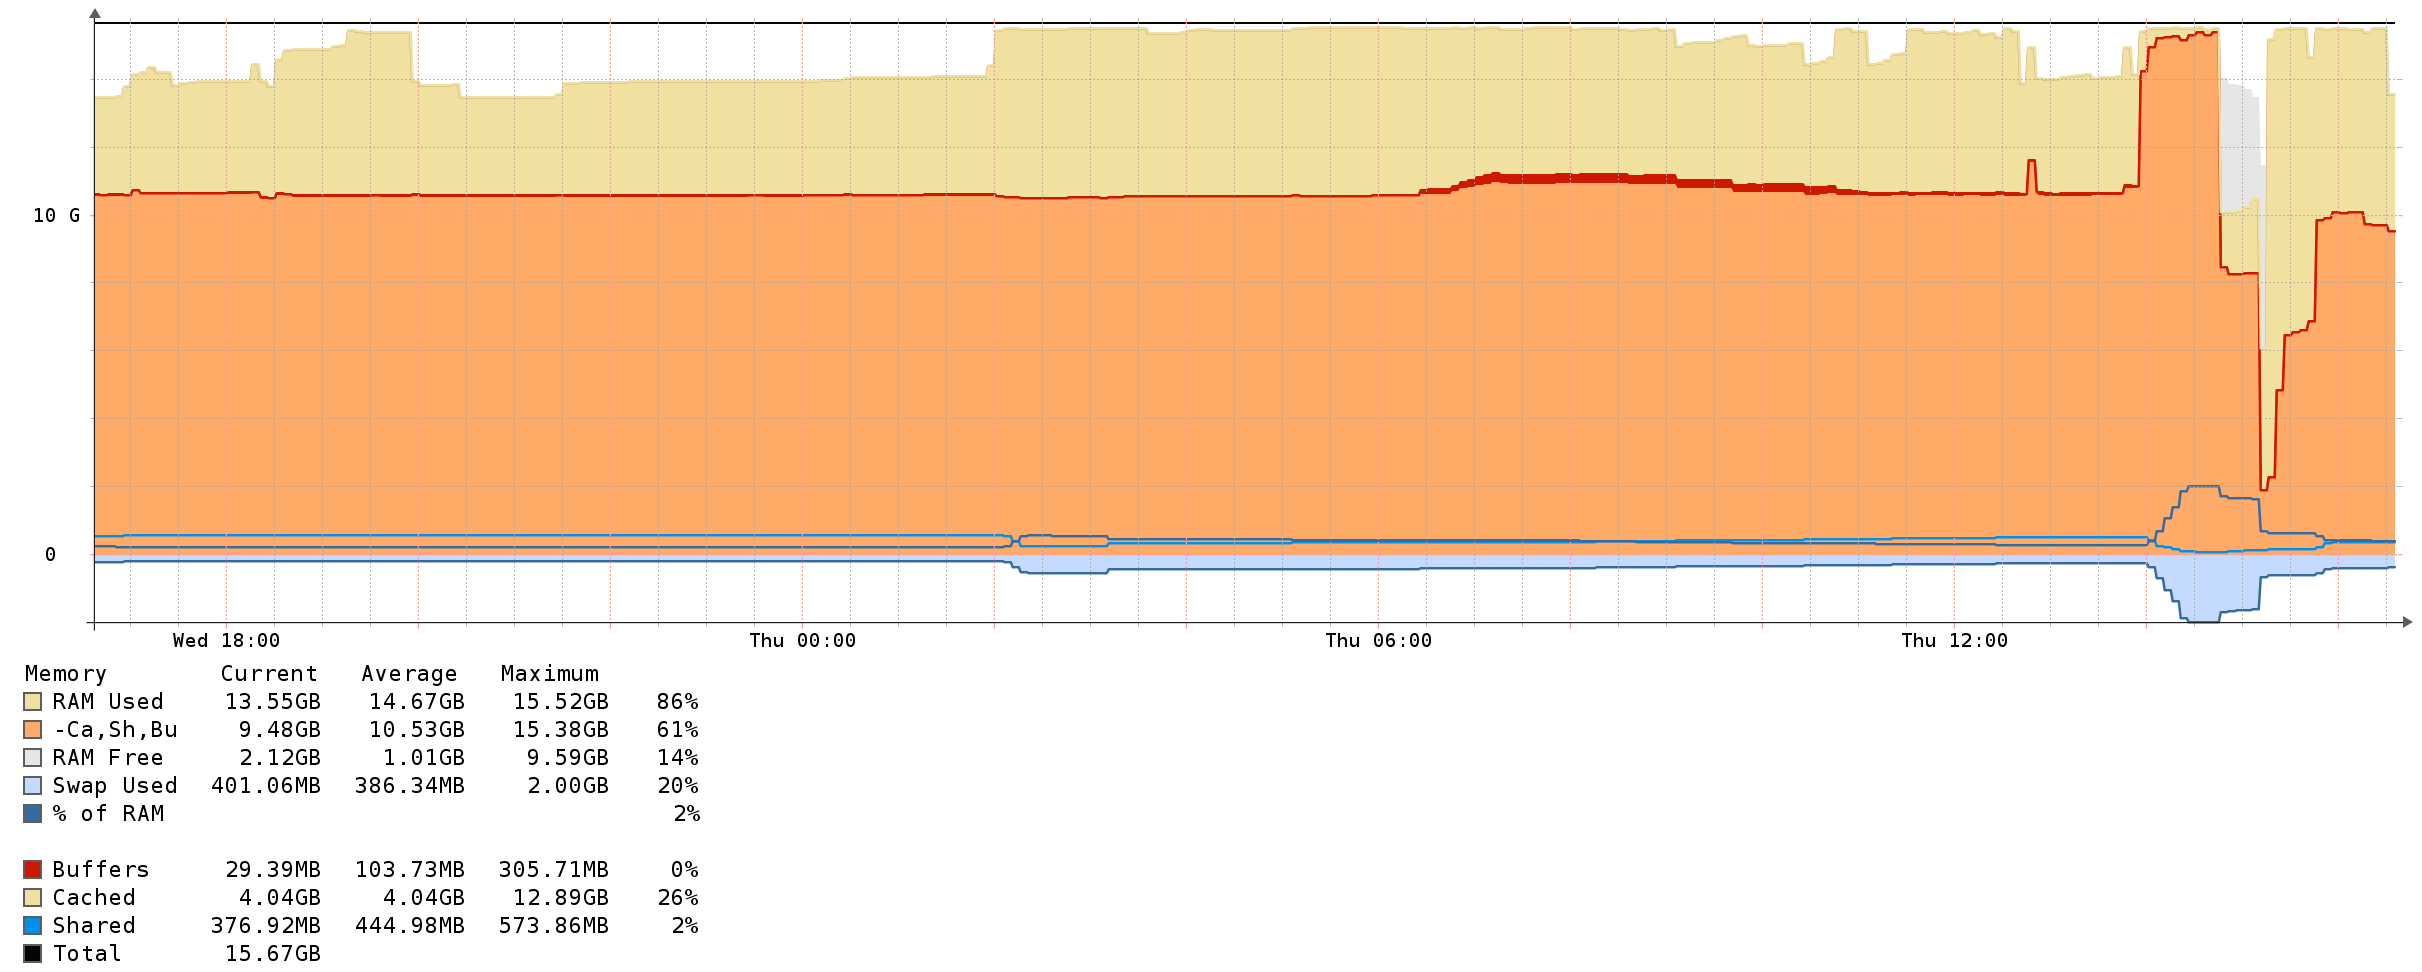
I have an alert on a linux server configured for "mempool_perc gt 90", which is firing all the time because of irrelevant caching use. Memory on Linux is always used. I'm more interested in the orange part of this graph:
The device is called ucd_memory. Is there a metric I can use to get the value that's at 61% in this graph, to catch spikes like the one at 14:00 time?
Thanks Maik

No. You need to limit the alert association to only the memory pool you want to alert on.
Obviously the memory pool alerts only use data from the memory pool infrastructure, and not from random os-specific graphs.
Adam.
Sent from BlueMail
On 1 Dec 2016, 15:41, at 15:41, "Musall, Maik" lists@musall.de wrote:
Hi,
I have an alert on a linux server configured for "mempool_perc gt 90", which is firing all the time because of irrelevant caching use. Memory on Linux is always used. I'm more interested in the orange part of this graph:
The device is called ucd_memory. Is there a metric I can use to get the value that's at 61% in this graph, to catch spikes like the one at 14:00 time?
Thanks Maik
observium mailing list observium@observium.org http://postman.memetic.org/cgi-bin/mailman/listinfo/observium
participants (2)
-
 Adam Armstrong
 -
 Musall, Maik