
Hello,
I want to monitor windows servers for C drive space. While I had a policy that was using the storage_perc gt 90 and it was working fine, I want to monitor instead just for servers with 5 GB of space or less, on any drive for now, then narrow it to certain drives.
I put storage_free lt 5 (thinking this would look for 5GB or less, maybe its 5% or less not sure) but it's throwing some alerts that are not true.
I get some servers with the art and when I check it shows as if the C drive had 0 B left, but in reality they have 11 GB and more free.
Any idea how I can accomplish what I want?
Thanks,
Darian
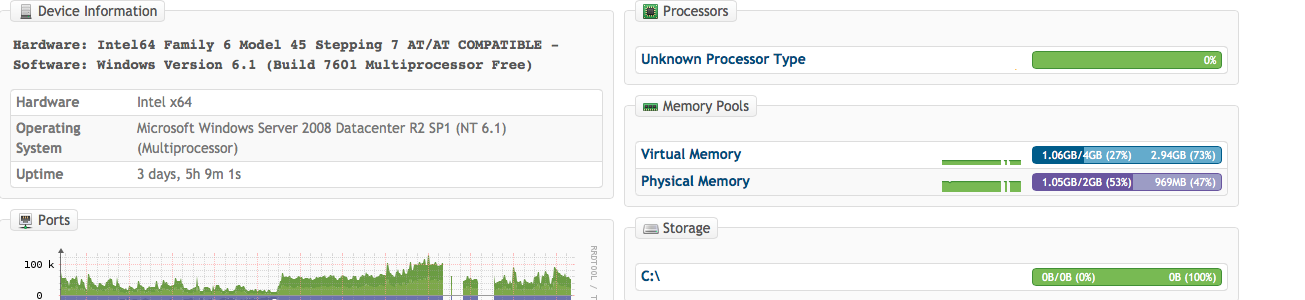
Nobody has a clue why Im having this problem? Screenshot attached showing that the C drive is not picking up.
Need help on this please. I've tried removing the server and re-adding it.
On Tue, Oct 21, 2014 at 11:52 AM, Darian Jimenez darian929@gmail.com wrote:
Hello,
I want to monitor windows servers for C drive space. While I had a policy that was using the storage_perc gt 90 and it was working fine, I want to monitor instead just for servers with 5 GB of space or less, on any drive for now, then narrow it to certain drives.
I put storage_free lt 5 (thinking this would look for 5GB or less, maybe its 5% or less not sure) but it's throwing some alerts that are not true.
I get some servers with the art and when I check it shows as if the C drive had 0 B left, but in reality they have 11 GB and more free.
Any idea how I can accomplish what I want?
Thanks,
Darian

Mine just worked – I would check your snmp service config
-Joe
From: observium [mailto:observium-bounces@observium.org] On Behalf Of Darian Jimenez Sent: Thursday, October 23, 2014 3:46 PM To: Observium Network Observation System Subject: Re: [Observium] Server drive space
Nobody has a clue why Im having this problem? Screenshot attached showing that the C drive is not picking up.
Need help on this please. I've tried removing the server and re-adding it.
On Tue, Oct 21, 2014 at 11:52 AM, Darian Jimenez <darian929@gmail.commailto:darian929@gmail.com> wrote: Hello,
I want to monitor windows servers for C drive space. While I had a policy that was using the storage_perc gt 90 and it was working fine, I want to monitor instead just for servers with 5 GB of space or less, on any drive for now, then narrow it to certain drives.
I put storage_free lt 5 (thinking this would look for 5GB or less, maybe its 5% or less not sure) but it's throwing some alerts that are not true.
I get some servers with the art and when I check it shows as if the C drive had 0 B left, but in reality they have 11 GB and more free.
Any idea how I can accomplish what I want?
Thanks,
Darian
Joseph,
Not sure your answer helps. I have a bit over 200 servers which all work fine. SNMP works. The issue Im having is that like 6-7 servers, although SNMP is working fine and they show the memory usage, the C drive space shows as 0. I've deleted these specific servers along with the rrd file and added them back. However still have the same issue.
On Thu, Oct 23, 2014 at 3:57 PM, Joseph L. Brunner joe@affirmedsystems.com wrote:
Mine just worked – I would check your snmp service config
-Joe
*From:* observium [mailto:observium-bounces@observium.org] *On Behalf Of *Darian Jimenez *Sent:* Thursday, October 23, 2014 3:46 PM *To:* Observium Network Observation System *Subject:* Re: [Observium] Server drive space
Nobody has a clue why Im having this problem? Screenshot attached showing that the C drive is not picking up.
Need help on this please. I've tried removing the server and re-adding it.
On Tue, Oct 21, 2014 at 11:52 AM, Darian Jimenez darian929@gmail.com wrote:
Hello,
I want to monitor windows servers for C drive space. While I had a policy that was using the storage_perc gt 90 and it was working fine, I want to monitor instead just for servers with 5 GB of space or less, on any drive for now, then narrow it to certain drives.
I put storage_free lt 5 (thinking this would look for 5GB or less, maybe its 5% or less not sure) but it's throwing some alerts that are not true.
I get some servers with the art and when I check it shows as if the C drive had 0 B left, but in reality they have 11 GB and more free.
Any idea how I can accomplish what I want?
Thanks,
Darian
observium mailing list observium@observium.org http://postman.memetic.org/cgi-bin/mailman/listinfo/observium
You’re running windows server 6.1 in that screenshot -> I’m running 6.2 (2012 Server).
Do this –
Add remove features – remove snmp and add it back.
Let me know
From: observium [mailto:observium-bounces@observium.org] On Behalf Of Darian Jimenez Sent: Thursday, October 23, 2014 4:04 PM To: Observium Network Observation System Subject: Re: [Observium] Server drive space
Joseph,
Not sure your answer helps. I have a bit over 200 servers which all work fine. SNMP works. The issue Im having is that like 6-7 servers, although SNMP is working fine and they show the memory usage, the C drive space shows as 0. I've deleted these specific servers along with the rrd file and added them back. However still have the same issue.
On Thu, Oct 23, 2014 at 3:57 PM, Joseph L. Brunner <joe@affirmedsystems.commailto:joe@affirmedsystems.com> wrote: Mine just worked – I would check your snmp service config
-Joe
From: observium [mailto:observium-bounces@observium.orgmailto:observium-bounces@observium.org] On Behalf Of Darian Jimenez Sent: Thursday, October 23, 2014 3:46 PM To: Observium Network Observation System Subject: Re: [Observium] Server drive space
Nobody has a clue why Im having this problem? Screenshot attached showing that the C drive is not picking up.
Need help on this please. I've tried removing the server and re-adding it.
On Tue, Oct 21, 2014 at 11:52 AM, Darian Jimenez <darian929@gmail.commailto:darian929@gmail.com> wrote: Hello,
I want to monitor windows servers for C drive space. While I had a policy that was using the storage_perc gt 90 and it was working fine, I want to monitor instead just for servers with 5 GB of space or less, on any drive for now, then narrow it to certain drives.
I put storage_free lt 5 (thinking this would look for 5GB or less, maybe its 5% or less not sure) but it's throwing some alerts that are not true.
I get some servers with the art and when I check it shows as if the C drive had 0 B left, but in reality they have 11 GB and more free.
Any idea how I can accomplish what I want?
Thanks,
Darian
_______________________________________________ observium mailing list observium@observium.orgmailto:observium@observium.org http://postman.memetic.org/cgi-bin/mailman/listinfo/observium

Windows is probably not reporting the drive properly. Alerts don't affect polling or graphing at all.
You should run the poller module with -d to see what the system is returning :
./poller.php -h <host> -m storage -d
adam.
------ Original Message ------ From: "Darian Jimenez" darian929@gmail.com To: "Observium Network Observation System" observium@observium.org Sent: 10/23/2014 2:45:55 PM Subject: Re: [Observium] Server drive space
Nobody has a clue why Im having this problem? Screenshot attached showing that the C drive is not picking up.
Need help on this please. I've tried removing the server and re-adding it.
On Tue, Oct 21, 2014 at 11:52 AM, Darian Jimenez darian929@gmail.com wrote:
Hello,
I want to monitor windows servers for C drive space. While I had a policy that was using the storage_perc gt 90 and it was working fine, I want to monitor instead just for servers with 5 GB of space or less, on any drive for now, then narrow it to certain drives.
I put storage_free lt 5 (thinking this would look for 5GB or less, maybe its 5% or less not sure) but it's throwing some alerts that are not true.
I get some servers with the art and when I check it shows as if the C drive had 0 B left, but in reality they have 11 GB and more free.
Any idea how I can accomplish what I want?
Thanks,
Darian
Adam,
here is the output.
DEBUG! Observium v0.14.10.5894 Poller
Starting polling run:
SQL[SELECT `device_id` FROM `devices` WHERE `disabled` = 0 AND `hostname` LIKE 'ojc020.domain.com' ORDER BY `device_id` ASC]
SQL[SELECT * FROM `devices` WHERE `device_id` = '252']
SQL[SELECT * FROM devices_attribs WHERE `device_id` = '252']
SQL[SELECT * FROM `alert_tests` WHERE 1] Cached 8 alert rules.
SQL[SELECT *,`alert_table`.`alert_table_id` AS `alert_table_id` FROM `alert_table` LEFT JOIN `alert_table-state` ON `alert_table`.`alert_table_id` = ` alert_table-state`.`alert_table_id` WHERE `device_id` = '252'] Array ( [1] => Array ( [alert_test_id] => 1 [entity_type] => device [alert_name] => Customer_Firewall_is_DOWN [alert_message] => Customer Firewall device is down [conditions] => Array ( [0] => Array ( [value] => 0 [condition] => eq [metric] => device_status )
)
[and] => 0 [severity] => crit [delay] => 0 [alerter] => default [enable] => 1 [show_frontpage] => 1 [suppress_recovery] => 0 [ignore_until] => )
[4] => Array ( [alert_test_id] => 4 [entity_type] => port [alert_name] => Juniper_Interface Errors [alert_message] => This interface is dropping packets!! [conditions] => Array ( [0] => Array ( [value] => 0 [condition] => gt [metric] => ifInErrors_rate )
[1] => Array ( [value] => 0 [condition] => gt [metric] => IfOutErrors_rate )
)
[and] => 0 [severity] => crit [delay] => 0 [alerter] => default [enable] => 1 [show_frontpage] => 1 [suppress_recovery] => 0 [ignore_until] => )
[6] => Array ( [alert_test_id] => 6 [entity_type] => device [alert_name] => Domain_Juniper_Swtich_DOWN [alert_message] => Our Juniper Switches are Down! [conditions] => Array ( [0] => Array ( [value] => 0 [condition] => eq [metric] => device_status )
)
[and] => 0 [severity] => crit [delay] => 0 [alerter] => default [enable] => 1 [show_frontpage] => 1 [suppress_recovery] => 0 [ignore_until] => )
[7] => Array ( [alert_test_id] => 7 [entity_type] => device [alert_name] => Domain_Firewall_is_DOWN [alert_message] => Domain Firewall is DOWN [conditions] => Array ( [0] => Array ( [value] => 0 [condition] => eq [metric] => device_status )
)
[and] => 0 [severity] => crit [delay] => 0 [alerter] => default [enable] => 1 [show_frontpage] => 1 [suppress_recovery] => 0 [ignore_until] => )
[8] => Array ( [alert_test_id] => 8 [entity_type] => port [alert_name] => Customer_Device_is_Dropping_Packets [alert_message] => Customer firewall is dropping packets! [conditions] => Array ( [0] => Array ( [value] => 0 [condition] => gt [metric] => ifInErrors_rate )
[1] => Array ( [value] => 0 [condition] => gt [metric] => IfOutErrors_rate )
)
[and] => 0 [severity] => crit [delay] => 0 [alerter] => default [enable] => 1 [show_frontpage] => 1 [suppress_recovery] => 0 [ignore_until] => )
[9] => Array ( [alert_test_id] => 9 [entity_type] => port [alert_name] => VPN_is_DOWN [alert_message] => VPN is down [conditions] => Array ( [0] => Array ( [value] => down [condition] => eq [metric] => ifOperStatus )
)
[and] => 0 [severity] => crit [delay] => 0 [alerter] => default [enable] => 1 [show_frontpage] => 1 [suppress_recovery] => 0 [ignore_until] => )
[10] => Array ( [alert_test_id] => 10 [entity_type] => mempool [alert_name] => OJC_Server_Memory_Warning [alert_message] => Server has reached 85% of it's memory [conditions] => Array ( [0] => Array ( [value] => 85 [condition] => gt [metric] => mempool_perc )
[1] => Array ( [value] => 95 [condition] => lt [metric] => mempool_perc )
)
[and] => 1 [severity] => crit [delay] => 0 [alerter] => default [enable] => 1 [show_frontpage] => 1 [suppress_recovery] => 0 [ignore_until] => )
[13] => Array ( [alert_test_id] => 13 [entity_type] => storage [alert_name] => Server Disk Space [alert_message] => This server has less then 5GB Free!! [conditions] => Array ( [0] => Array ( [value] => 5 [condition] => lt [metric] => storage_free )
)
[and] => 1 [severity] => crit [delay] => 0 [alerter] => default [enable] => 1 [show_frontpage] => 1 [suppress_recovery] => 0 [ignore_until] => )
) Array ( [mempool] => Array ( [512] => Array ( [10] => Array ( [alert_table_id] => 1798 [alert_test_id] => 10 [device_id] => 252 [entity_type] => mempool [entity_id] => 512 [alert_assocs] => 10 [delay] => 0 [ignore_until] => [ignore_until_ok] => 0 [last_checked] => 1414097457 [last_changed] => 1414093417 [last_recovered] => 0 [last_failed] => 0 [has_alerted] => 0 [last_message] => Checks OK [alert_status] => 1 [last_alerted] => 0 [state] => {"metrics":{"mempool_perc":26.56},"failed":[{"value":"95","condition":"lt","metric":"mempool_perc"}]} [count] => 0 [state_entry] => 1 )
)
[513] => Array ( [10] => Array ( [alert_table_id] => 1799 [alert_test_id] => 10 [device_id] => 252 [entity_type] => mempool [entity_id] => 513 [alert_assocs] => 10 [delay] => 0 [ignore_until] => [ignore_until_ok] => 0 [last_checked] => 1414097457 [last_changed] => 1414093417 [last_recovered] => 0 [last_failed] => 0 [has_alerted] => 0 [last_message] => Checks OK [alert_status] => 1 [last_alerted] => 0 [state] => {"metrics":{"mempool_perc":52.61},"failed":[{"value":"95","condition":"lt","metric":"mempool_perc"}]} [count] => 0 [state_entry] => 1 )
)
)
[storage] => Array ( [447] => Array ( [13] => Array ( [alert_table_id] => 1800 [alert_test_id] => 13 [device_id] => 252 [entity_type] => storage [entity_id] => 447 [alert_assocs] => 13 [delay] => 0 [ignore_until] => [ignore_until_ok] => [last_checked] => 1414097463 [last_changed] => 1414093423 [last_recovered] => 0 [last_failed] => 1414093423 [has_alerted] => 1 [last_message] => Checks failed [alert_status] => 0 [last_alerted] => 1414097467 [state] => {"metrics":{"storage_free":0},"failed":[{"value":"5","condition":"lt","metric":"storage_free"}]} [count] => 16 [state_entry] => 1 )
)
)
) ojc020.domain.com 252 windows
CMD[/usr/bin/snmpget -v2c -c *** -OQUst -m SNMPv2-MIB -M /opt/observium/mibs/rfc:/opt/observium/mibs/net-snmp 'udp':' ojc020.domain.com':'161' sysObject ID.0 sysUpTime.0] EXITCODE[0] RUNTIME[0.0135s], STDOUT[ sysObjectID.0 = enterprises.311.1.1.3.1.3 sysUpTime.0 = 28196675 ] SNMP_STATUS[TRUE] RRD /opt/observium/rrd/ojc020.domain.com/status.rrd already exists - no need to create. RRD[cmd[update /opt/observium/rrd/ojc020.domain.com/status.rrd N:1] stdout[OK u:0.00 s:0.00 r:0.12] stderr[]] RRD /opt/observium/rrd/ojc020.domain.com/ping.rrd already exists - no need to create. RRD[cmd[update /opt/observium/rrd/ojc020.domain.com/ping.rrd N:0.96] stdout[OK u:0.00 s:0.00 r:0.13] stderr[]] RRD /opt/observium/rrd/ojc020.domain.com/ping_snmp.rrd already exists - no need to create. RRD[cmd[update /opt/observium/rrd/ojc020.domain.com/ping_snmp.rrd N:18.99] stdout[OK u:0.00 s:0.00 r:0.13] stderr[]]
SQL[SELECT * FROM `device_graphs` WHERE `device_id` = '252']
including: includes/polling/system.inc.php
CMD[/usr/bin/snmpget -v2c -c *** -OQUs -m SNMPv2-MIB -M /opt/observium/mibs/rfc:/opt/observium/mibs/net-snmp 'udp':' ojc020.domain.com':'161' sysUpTime. 0 sysLocation.0 sysContact.0 sysName.0] EXITCODE[0] RUNTIME[0.0135s], STDOUT[ sysUpTime.0 = 3:6:19:26.78 sysLocation.0 = sysContact.0 = sysName.0 = ojc020.domain.com ] SNMP_STATUS[TRUE]
CMD[/usr/bin/snmpget -v2c -c *** -Oqv -m SNMPv2-MIB -M /opt/observium/mibs/rfc:/opt/observium/mibs/net-snmp 'udp':' ojc020.domain.com':'161' sysDescr.0] EXITCODE[0] RUNTIME[0.0124s], STDOUT[ Hardware: Intel64 Family 6 Model 45 Stepping 7 AT/AT COMPATIBLE - Software: Windows Version 6.1 (Build 7601 Multiprocessor Free) ] SNMP_STATUS[TRUE]
CMD[/usr/bin/snmpget -v2c -c *** -Oqvn -m SNMPv2-MIB -M /opt/observium/mibs/rfc:/opt/observium/mibs/net-snmp 'udp':' ojc020.domain.com':'161' sysObjectI D.0] EXITCODE[0] RUNTIME[0.015s], STDOUT[ .1.3.6.1.4.1.311.1.1.3.1.3 ] SNMP_STATUS[TRUE]
CMD[/usr/bin/snmpget -v2c -c *** -Ovqn -m SNMP-FRAMEWORK-MIB -M /opt/observium/mibs/rfc:/opt/observium/mibs/net-snmp 'udp':' ojc020.domain.com':'161' sn mpEngineID.0] EXITCODE[0] RUNTIME[0.0099s], STDOUT[ No Such Object available on this agent at this OID ] SNMP_STATUS[FALSE]
CMD[/usr/bin/snmpget -v2c -c *** -Oqv -m HOST-RESOURCES-MIB -M /opt/observium/mibs/rfc:/opt/observium/mibs/net-snmp 'udp':' ojc020.domain.com':'161' hrS ystemUptime.0] EXITCODE[0] RUNTIME[0.0179s], STDOUT[ 46:11:33:43.93 ] SNMP_STATUS[TRUE]
CMD[/usr/bin/snmpget -v2c -c *** -OUqv -m SNMP-FRAMEWORK-MIB -M /opt/observium/mibs/rfc:/opt/observium/mibs/net-snmp 'udp':' ojc020.domain.com':'161' sn mpEngineTime.0] EXITCODE[0] RUNTIME[0.011s], STDOUT[ No Such Object available on this agent at this OID ] SNMP_STATUS[FALSE] Using SNMP Agent sysUpTime (281966 seconds) RRD /opt/observium/rrd/ojc020.domain.com/uptime.rrd already exists - no need to create. RRD[cmd[update /opt/observium/rrd/ojc020.domain.com/uptime.rrd N:281966] stdout[OK u:0.00 s:0.00 r:0.25] stderr[]] Uptime: 3 days, 6h 19m 26s Module [ system ] time: 0.1185s
including: includes/polling/os.inc.php
CMD[/usr/bin/snmpget -v2c -c *** -Oqv -m MIB-Dell-10892 -M /opt/observium/mibs/rfc:/opt/observium/mibs/net-snmp:/opt/observium/mibs/dell 'udp':'ojc020.domain.com':'161' .1.3.6.1.4.1.674.10892.1.300.10.1.9.1] EXITCODE[0] RUNTIME[0.0557s], STDOUT[ No Such Object available on this agent at this OID ] SNMP_STATUS[FALSE]
CMD[/usr/bin/snmpget -v2c -c *** -Oqv -m MIB-Dell-10892 -M /opt/observium/mibs/rfc:/opt/observium/mibs/net-snmp:/opt/observium/mibs/dell 'udp':'ojc020.domain.com':'161' .1.3.6.1.4.1.674.10892.1.300.10.1.11.1] EXITCODE[0] RUNTIME[0.0436s], STDOUT[ No Such Object available on this agent at this OID ] SNMP_STATUS[FALSE]
Hardware: Intel x64 Version: Server 2008 Datacenter R2 SP1 (NT 6.1) Features: Multiprocessor Serial: Asset: Module [ os ] time: 0.1114s
including: includes/polling/storage.inc.php
SQL[SELECT `version` FROM `dbSchema`]
SQL[SELECT `storage`.*, `storage-state`.storage_polled FROM `storage` LEFT JOIN `storage-state` ON `storage`.storage_id = `storage-state`.storage_id WHER E `device_id` = '252'] RRD /opt/observium/rrd/ ojc020.domain.com/storage-host-resources-mib-C___Label___Serial_Number_369a20f0.rrd already exists - no need to create.
CMD[/usr/bin/snmpbulkwalk -v2c -c *** -OQUs -m HOST-RESOURCES-MIB -M /opt/observium/mibs/rfc:/opt/observium/mibs/net-snmp 'udp':' ojc020.domain.com':'16 1' hrStorageEntry] EXITCODE[0] RUNTIME[5.2537s], STDOUT[ hrStorageIndex.1 = 1 hrStorageIndex.2 = 2 hrStorageIndex.3 = 3 hrStorageIndex.4 = 4 hrStorageIndex.5 = 5 hrStorageType.1 = hrStorageTypes.5 hrStorageType.2 = hrStorageTypes.4 hrStorageType.3 = hrStorageTypes.7 hrStorageType.4 = hrStorageTypes.3 hrStorageType.5 = hrStorageTypes.2 hrStorageDescr.1 = A:\ hrStorageDescr.2 = C:\ Label: Serial Number 369a20f0 hrStorageDescr.3 = D:\ hrStorageDescr.4 = Virtual Memory hrStorageDescr.5 = Physical Memory hrStorageAllocationUnits.1 = 0 hrStorageAllocationUnits.2 = 4096 hrStorageAllocationUnits.3 = 0 hrStorageAllocationUnits.4 = 65536 hrStorageAllocationUnits.5 = 65536 hrStorageSize.1 = 0 hrStorageSize.2 = 10459647 hrStorageSize.3 = 0 hrStorageSize.4 = 65521 hrStorageSize.5 = 32760 hrStorageUsed.1 = 0 hrStorageUsed.2 = 4637022 hrStorageUsed.3 = 0 hrStorageUsed.4 = 17410 hrStorageUsed.5 = 17264 hrStorageAllocationFailures.1 = 0 hrStorageAllocationFailures.2 = 0 hrStorageAllocationFailures.3 = 0 hrStorageAllocationFailures.4 = 0 hrStorageAllocationFailures.5 = 0 ] SNMP_STATUS[TRUE] Array ( [1] => Array ( [hrStorageIndex] => 1 [hrStorageType] => hrStorageTypes.5 [hrStorageDescr] => A:\ [hrStorageAllocationUnits] => 0 [hrStorageSize] => 0 [hrStorageUsed] => 0 [hrStorageAllocationFailures] => 0 )
[2] => Array ( [hrStorageIndex] => 2 [hrStorageType] => hrStorageTypes.4 [hrStorageDescr] => C:\ Label: Serial Number 369a20f0 [hrStorageAllocationUnits] => 4096 [hrStorageSize] => 10459647 [hrStorageUsed] => 4637022 [hrStorageAllocationFailures] => 0 )
[3] => Array ( [hrStorageIndex] => 3 [hrStorageType] => hrStorageTypes.7 [hrStorageDescr] => D:\ [hrStorageAllocationUnits] => 0 [hrStorageSize] => 0 [hrStorageUsed] => 0 [hrStorageAllocationFailures] => 0 )
[4] => Array ( [hrStorageIndex] => 4 [hrStorageType] => hrStorageTypes.3 [hrStorageDescr] => Virtual Memory [hrStorageAllocationUnits] => 65536 [hrStorageSize] => 65521 [hrStorageUsed] => 17410 [hrStorageAllocationFailures] => 0 )
[5] => Array ( [hrStorageIndex] => 5 [hrStorageType] => hrStorageTypes.2 [hrStorageDescr] => Physical Memory [hrStorageAllocationUnits] => 65536 [hrStorageSize] => 32760 [hrStorageUsed] => 17264 [hrStorageAllocationFailures] => 0 )
) Array ( [storage_id] => 447 [device_id] => 252 [storage_mib] => host-resources-mib [storage_index] => 2 [storage_type] => hrStorageFixedDisk [storage_descr] => C:\ Label: Serial Number 369a20f0 [storage_hc] => 0 [storage_deleted] => 0 [storage_polled] => 1414097463 [units] => 4096 [used] => 18993242112 [size] => 42842714112 [free] => 23849472000 ) Storage C:\ Label: Serial Number 369a20f0: 44.33% RRD[cmd[update /opt/observium/rrd/ ojc020.domain.com/storage-host-resources-mib-C___Label___Serial_Number_369a20f0.rrd N:18993242112:23849472000] stdout[OK u:0.00 s:0.00 r:5.63] stderr[]]
SQL[UPDATE `storage-state` set `storage_polled` ='1414097642',`storage_used` ='18993242112',`storage_free` ='23849472000',`storage_size` ='42842714112',`s torage_units` ='4096',`storage_perc` ='44.33' WHERE `storage_id` = '447']
Checking alerts Array ( [storage_perc] => 44.33 [storage_free] => 23849472000 [storage_used] => 18993242112 ) Checking alert 13 associated by 13 Testing: storage_free lt 5 (value: 23849472000) OK Checks OK.
SQL[INSERT INTO `alert_log` (`alert_test_id`,`device_id`,`entity_type`,`entity_id`,`timestamp`,`log_type`,`message`) VALUES ('13','252','storage','447',N OW(),'OK','Checks succeeded')]
SQL[UPDATE `alert_table-state` set `state` ='{"metrics":{"storage_free":23849472000}}',`count` ='0',`alert_status` ='1',`last_message` ='Checks OK',`l ast_checked` ='1414097642',`last_changed` ='1414097642' WHERE `alert_table_id` = '1800']
SQL[UPDATE `alert_table` set `ignore_until_ok` ='0' WHERE `alert_table_id` = '1800'] RRD /opt/observium/rrd/ojc020.domain.com/alert-1800.rrd already exists - no need to create. RRD[cmd[update /opt/observium/rrd/ojc020.domain.com/alert-1800.rrd N:1:1] stdout[OK u:0.00 s:0.00 r:5.64] stderr[]]
Module [ storage ] time: 5.2733s Graphs [checked]: ping, ping_snmp, uptime, storage
Polled in 5.5539 seconds Updating ojc020.domain.com - Array ( [uptime] => 281966 [last_polled] => Array ( [0] => NOW() )
[last_polled_timetaken] => 5.5539 [device_state] => a:1:{s:15:"poller_mod_perf";a:3:{s:6:"system";s:6:"0.1185";s:2:"os";s:6:"0.1114";s:7:"storage";s:6:"5.2733";}} )
SQL[UPDATE `devices` set `uptime` ='281966',`last_polled` =NOW(),`last_polled_timetaken` ='5.5539',`device_state` ='a:1:{s:15:"poller_mod_perf";a:3:{s:6 :"system";s:6:"0.1185";s:2:"os";s:6:"0.1114";s:7:"storage";s:6:"5.2733";}}' WHERE `device_id` = '252'] UPDATED!
Checking alerts Array ( [device_status] => 1 [device_status_type] => [device_ping] => 0.96 [device_snmp] => 18.99 [device_uptime] => 281782 [device_duration_poll] => 15.00 )
SQL[INSERT INTO `perf_times` (`type`,`doing`,`start`,`duration`,`devices`) VALUES ('poll','ojc020.domain.com','1414097636.4408','5.654','1')] ./poller.php: ojc020.domain.com - 1 devices polled in 5.654 secs NOTE, $config['snmp']['hide_auth'] sets as TRUE, snmp community and snmp v3 auth hidden from debug output. MySQL: Cell[1/0s] Row[1/0.01s] Rows[1/0s] Column[0/0s] Update[4/0.01s] Insert[2/0.01s] Delete[0/0s]
On Thu, Oct 23, 2014 at 4:49 PM, Adam Armstrong adama@memetic.org wrote:
Windows is probably not reporting the drive properly. Alerts don't affect polling or graphing at all.
You should run the poller module with -d to see what the system is returning :
./poller.php -h <host> -m storage -d
adam.
------ Original Message ------ From: "Darian Jimenez" darian929@gmail.com To: "Observium Network Observation System" observium@observium.org Sent: 10/23/2014 2:45:55 PM Subject: Re: [Observium] Server drive space
Nobody has a clue why Im having this problem? Screenshot attached showing that the C drive is not picking up.
Need help on this please. I've tried removing the server and re-adding it.
On Tue, Oct 21, 2014 at 11:52 AM, Darian Jimenez darian929@gmail.com wrote:
Hello,
I want to monitor windows servers for C drive space. While I had a policy that was using the storage_perc gt 90 and it was working fine, I want to monitor instead just for servers with 5 GB of space or less, on any drive for now, then narrow it to certain drives.
I put storage_free lt 5 (thinking this would look for 5GB or less, maybe its 5% or less not sure) but it's throwing some alerts that are not true.
I get some servers with the art and when I check it shows as if the C drive had 0 B left, but in reality they have 11 GB and more free.
Any idea how I can accomplish what I want?
Thanks,
Darian
observium mailing list observium@observium.org http://postman.memetic.org/cgi-bin/mailman/listinfo/observium
participants (3)
-
 Adam Armstrong
 -
 Darian Jimenez
 -
 Joseph L. Brunner