
Hi.
Has anyone else experienced the same issue where after the Observium upgrade (9657) the new dashboard is showing empty transit and peering traffic graphs?
Before the upgrade they were showing the traffic data fine, but on the new dashboard based front page, the graphs are empty?
I’ve cleared browser cache etc and waited for a while.
I have also tried adding a new graph, which involves browsing to the aggregate transit graph and click add to widget etc. But that only creates a mini graph (which does show).
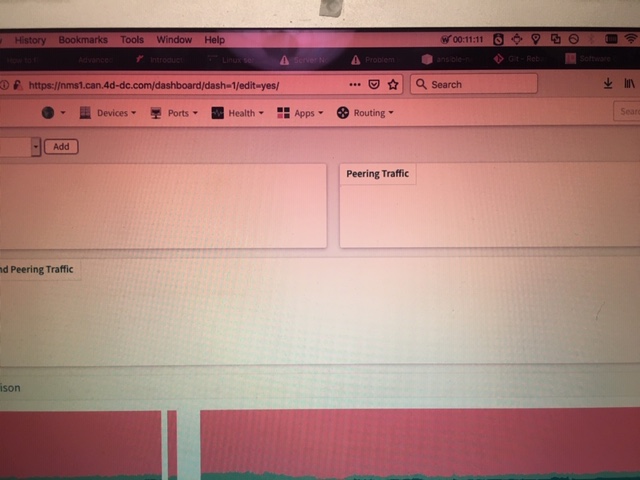
The nice front page graphs for Transit, Peering, and Transit and Peering are just white :(
[image1.jpeg]
The Gap the graph below was from the upgrade maintenance as I also upgraded the distribution with apt upgrade etc.
Everything else seems ok
Thanks, Andy.
Sent from a teeny tiny keyboard, so please excuse typos

I have the same issue this morning also -- widgets for the peering/transit traffic are empty boxes. Had not run an update since mid-December due to the vacation period.
Any helpful suggestions on why the widgets would not display data or debug information that can be provided?
On Mon, Jan 7, 2019 at 10:10 AM adama--- via observium < observium@observium.org> wrote:
Shit corporate browser from 1973? Shit corporate firewall?
My money would be on those. :D
The new dashboard has been in rolling release for 2 months already.
Adam.
-------- Original Message -------- Subject: [Observium] Blank Dashboards From: Andrew Lemin via observium To: observium@observium.org CC: Andrew Lemin
Hi.
Has anyone else experienced the same issue where after the Observium upgrade (9657) the new dashboard is showing empty transit and peering traffic graphs?
Before the upgrade they were showing the traffic data fine, but on the new dashboard based front page, the graphs are empty?
I’ve cleared browser cache etc and waited for a while.
I have also tried adding a new graph, which involves browsing to the aggregate transit graph and click add to widget etc. But that only creates a mini graph (which does show).
The nice front page graphs for Transit, Peering, and Transit and Peering are just white :(
[image: image1.jpeg]
The Gap the graph below was from the upgrade maintenance as I also upgraded the distribution with apt upgrade etc.
Everything else seems ok
Thanks, Andy.
Sent from a teeny tiny keyboard, so please excuse typos
observium mailing list observium@observium.org http://postman.memetic.org/cgi-bin/mailman/listinfo/observium

If this helps -- widget.php is running but only receives a 490 byte PNG response from the server for all three of the transit/peering/both widgets.
Hitting the URL in the request directly spits out:
Function generate_query_permitted() on page '' called before include cache-data.inc.php or something wrong with caching permissions. Please report this to developers! Function generate_query_permitted() on page '' called before include cache-data.inc.php or something wrong with caching permissions. Please report this to developers!
On Mon, Jan 7, 2019 at 10:49 AM McDonald Richards < mcdonald.richards@gmail.com> wrote:
I have the same issue this morning also -- widgets for the peering/transit traffic are empty boxes. Had not run an update since mid-December due to the vacation period.
Any helpful suggestions on why the widgets would not display data or debug information that can be provided?
On Mon, Jan 7, 2019 at 10:10 AM adama--- via observium < observium@observium.org> wrote:
Shit corporate browser from 1973? Shit corporate firewall?
My money would be on those. :D
The new dashboard has been in rolling release for 2 months already.
Adam.
-------- Original Message -------- Subject: [Observium] Blank Dashboards From: Andrew Lemin via observium To: observium@observium.org CC: Andrew Lemin
Hi.
Has anyone else experienced the same issue where after the Observium upgrade (9657) the new dashboard is showing empty transit and peering traffic graphs?
Before the upgrade they were showing the traffic data fine, but on the new dashboard based front page, the graphs are empty?
I’ve cleared browser cache etc and waited for a while.
I have also tried adding a new graph, which involves browsing to the aggregate transit graph and click add to widget etc. But that only creates a mini graph (which does show).
The nice front page graphs for Transit, Peering, and Transit and Peering are just white :(
[image: image1.jpeg]
The Gap the graph below was from the upgrade maintenance as I also upgraded the distribution with apt upgrade etc.
Everything else seems ok
Thanks, Andy.
Sent from a teeny tiny keyboard, so please excuse typos
observium mailing list observium@observium.org http://postman.memetic.org/cgi-bin/mailman/listinfo/observium

I had this issue when I did svn update but forgot to run the database update. Try doing ./discovery.php -u
On Sun, Jan 6, 2019, 3:49 PM McDonald Richards via observium < observium@observium.org wrote:
I have the same issue this morning also -- widgets for the peering/transit traffic are empty boxes. Had not run an update since mid-December due to the vacation period.
Any helpful suggestions on why the widgets would not display data or debug information that can be provided?
On Mon, Jan 7, 2019 at 10:10 AM adama--- via observium < observium@observium.org> wrote:
Shit corporate browser from 1973? Shit corporate firewall?
My money would be on those. :D
The new dashboard has been in rolling release for 2 months already.
Adam.
-------- Original Message -------- Subject: [Observium] Blank Dashboards From: Andrew Lemin via observium To: observium@observium.org CC: Andrew Lemin
Hi.
Has anyone else experienced the same issue where after the Observium upgrade (9657) the new dashboard is showing empty transit and peering traffic graphs?
Before the upgrade they were showing the traffic data fine, but on the new dashboard based front page, the graphs are empty?
I’ve cleared browser cache etc and waited for a while.
I have also tried adding a new graph, which involves browsing to the aggregate transit graph and click add to widget etc. But that only creates a mini graph (which does show).
The nice front page graphs for Transit, Peering, and Transit and Peering are just white :(
[image: image1.jpeg]
The Gap the graph below was from the upgrade maintenance as I also upgraded the distribution with apt upgrade etc.
Everything else seems ok
Thanks, Andy.
Sent from a teeny tiny keyboard, so please excuse typos
observium mailing list observium@observium.org http://postman.memetic.org/cgi-bin/mailman/listinfo/observium
observium mailing list observium@observium.org http://postman.memetic.org/cgi-bin/mailman/listinfo/observium
Ran the discovery with update switch this morning after update -- no errors. Have also kicked off a yum update (Centos 7.6.1810) and restarted httpd. Issue persists.
Updated to revision 9661. [someguy@observium observium]# ./discovery.php -u
___ _ _ / _ \ | |__ ___ ___ _ __ __ __(_) _ _ _ __ ___ | | | || '_ \ / __| / _ | '__|\ \ / /| || | | || '_ ` _ \ | |_| || |_) |__ | __/| | \ V / | || |_| || | | | | | ___/ |_.__/ |___/ ___||_| _/ |_| __,_||_| |_| |_| Observium Professional 19.1.9661 http://www.observium.org
-- Updating database/file schema 386 -> 387 # (db) . Done (0s). 387 -> 388 # (php) Renaming files containing commas [...................................................................................................................................................................................................................................................................] Done (3s). 388 -> 389 # (db) .. Done (0s). 389 -> 390 # (db) ... Done (0s). 390 -> 391 # (db) .. Done (0s). 391 -> 392 # (db) . Done (0s). 392 -> 393 # (db) ... Done (0s). 393 -> 394 # (db) . Done (0s). 394 -> 395 # (db) . Done (1s). 395 -> 396 # (db) .. Done (0s). 396 -> 397 # (db) ......... Done (3s). -- Done.
On Mon, Jan 7, 2019 at 11:14 AM Cody Cook observium@codycook.us wrote:
I had this issue when I did svn update but forgot to run the database update. Try doing ./discovery.php -u
On Sun, Jan 6, 2019, 3:49 PM McDonald Richards via observium < observium@observium.org wrote:
I have the same issue this morning also -- widgets for the peering/transit traffic are empty boxes. Had not run an update since mid-December due to the vacation period.
Any helpful suggestions on why the widgets would not display data or debug information that can be provided?
On Mon, Jan 7, 2019 at 10:10 AM adama--- via observium < observium@observium.org> wrote:
Shit corporate browser from 1973? Shit corporate firewall?
My money would be on those. :D
The new dashboard has been in rolling release for 2 months already.
Adam.
-------- Original Message -------- Subject: [Observium] Blank Dashboards From: Andrew Lemin via observium To: observium@observium.org CC: Andrew Lemin
Hi.
Has anyone else experienced the same issue where after the Observium upgrade (9657) the new dashboard is showing empty transit and peering traffic graphs?
Before the upgrade they were showing the traffic data fine, but on the new dashboard based front page, the graphs are empty?
I’ve cleared browser cache etc and waited for a while.
I have also tried adding a new graph, which involves browsing to the aggregate transit graph and click add to widget etc. But that only creates a mini graph (which does show).
The nice front page graphs for Transit, Peering, and Transit and Peering are just white :(
[image: image1.jpeg]
The Gap the graph below was from the upgrade maintenance as I also upgraded the distribution with apt upgrade etc.
Everything else seems ok
Thanks, Andy.
Sent from a teeny tiny keyboard, so please excuse typos
observium mailing list observium@observium.org http://postman.memetic.org/cgi-bin/mailman/listinfo/observium
observium mailing list observium@observium.org http://postman.memetic.org/cgi-bin/mailman/listinfo/observium
Hi Adam and list,
With the kind help from an old colleague (kudos Chris), who had the same issue, the problem was simply due to the existence of the following line in our config.php; $config['allow_unauth_graphs_cidr'] = array('10.0.0.0/8','172.16.0.0/12','192.168.0.0/16');
I know you only meant it in light jest, but you rather jumped the gun there Adam to blame things other than Observium 😉 Regardless of how long a new feature has been running for, there will always be entropy from different configurations out in the field.. And it can often take a long time for all the variants to float to the surface 😊
So as this has/is happening to others as well, it seems we can say with some confidence that the 'allow_unauth_graphs_cidr' property is broken now. Or at the very least, now has the opposite effect by reducing any elevated permissions.
Markus, for now until Adam can have a look at what is going on, just add a comment ‘#’ in front of this line in your config.php.
Thanks chaps, Andy Lemin
From: Markus Klock via observium observium@observium.org Reply-To: Markus Klock via observium observium@observium.org Date: Sunday, 6 January 2019 at 23:49 To: Markus Klock via observium observium@observium.org Cc: McDonald Richards mcdonald.richards@gmail.com, Adam Armstrong adama@memetic.org Subject: Re: [Observium] Blank Dashboards
I have the same issue this morning also -- widgets for the peering/transit traffic are empty boxes. Had not run an update since mid-December due to the vacation period.
Any helpful suggestions on why the widgets would not display data or debug information that can be provided?
On Mon, Jan 7, 2019 at 10:10 AM adama--- via observium <observium@observium.orgmailto:observium@observium.org> wrote: Shit corporate browser from 1973? Shit corporate firewall?
My money would be on those. :D
The new dashboard has been in rolling release for 2 months already.
Adam.
-------- Original Message -------- Subject: [Observium] Blank Dashboards From: Andrew Lemin via observium To: observium@observium.orgmailto:observium@observium.org CC: Andrew Lemin
Hi.
Has anyone else experienced the same issue where after the Observium upgrade (9657) the new dashboard is showing empty transit and peering traffic graphs?
Before the upgrade they were showing the traffic data fine, but on the new dashboard based front page, the graphs are empty?
I’ve cleared browser cache etc and waited for a while.
I have also tried adding a new graph, which involves browsing to the aggregate transit graph and click add to widget etc. But that only creates a mini graph (which does show).
The nice front page graphs for Transit, Peering, and Transit and Peering are just white :(
Error! Filename not specified. The Gap the graph below was from the upgrade maintenance as I also upgraded the distribution with apt upgrade etc.
Everything else seems ok
Thanks, Andy.
Sent from a teeny tiny keyboard, so please excuse typos _______________________________________________ observium mailing list observium@observium.orgmailto:observium@observium.org http://postman.memetic.org/cgi-bin/mailman/listinfo/observium

Ahh yeah.
This was an issue we already found in rolling. I can’t actually replicate it on my system, though.
Adam.
From: observium observium-bounces@observium.org On Behalf Of Andrew Lemin via observium Sent: 07 January 2019 10:39 To: observium@observium.org Cc: Andrew Lemin AndrewL@4d-dc.com; McDonald Richards mcdonald.richards@gmail.com; Adam Armstrong adama@memetic.org Subject: Re: [Observium] Blank Dashboards
Hi Adam and list,
With the kind help from an old colleague (kudos Chris), who had the same issue, the problem was simply due to the existence of the following line in our config.php;
$config['allow_unauth_graphs_cidr'] = array('10.0.0.0/8','172.16.0.0/12','192.168.0.0/16');
I know you only meant it in light jest, but you rather jumped the gun there Adam to blame things other than Observium 😉
Regardless of how long a new feature has been running for, there will always be entropy from different configurations out in the field.. And it can often take a long time for all the variants to float to the surface 😊
So as this has/is happening to others as well, it seems we can say with some confidence that the 'allow_unauth_graphs_cidr' property is broken now. Or at the very least, now has the opposite effect by reducing any elevated permissions.
Markus, for now until Adam can have a look at what is going on, just add a comment ‘#’ in front of this line in your config.php.
Thanks chaps, Andy Lemin
From: Markus Klock via observium < mailto:observium@observium.org observium@observium.org> Reply-To: Markus Klock via observium < mailto:observium@observium.org observium@observium.org> Date: Sunday, 6 January 2019 at 23:49 To: Markus Klock via observium < mailto:observium@observium.org observium@observium.org> Cc: McDonald Richards < mailto:mcdonald.richards@gmail.com mcdonald.richards@gmail.com>, Adam Armstrong < mailto:adama@memetic.org adama@memetic.org> Subject: Re: [Observium] Blank Dashboards
I have the same issue this morning also -- widgets for the peering/transit traffic are empty boxes. Had not run an update since mid-December due to the vacation period.
Any helpful suggestions on why the widgets would not display data or debug information that can be provided?
On Mon, Jan 7, 2019 at 10:10 AM adama--- via observium <observium@observium.org mailto:observium@observium.org > wrote:
Shit corporate browser from 1973? Shit corporate firewall?
My money would be on those. :D
The new dashboard has been in rolling release for 2 months already.
Adam.
-------- Original Message -------- Subject: [Observium] Blank Dashboards From: Andrew Lemin via observium To: observium@observium.org mailto:observium@observium.org CC: Andrew Lemin
Hi.
Has anyone else experienced the same issue where after the Observium upgrade (9657) the new dashboard is showing empty transit and peering traffic graphs?
Before the upgrade they were showing the traffic data fine, but on the new dashboard based front page, the graphs are empty?
I’ve cleared browser cache etc and waited for a while.
I have also tried adding a new graph, which involves browsing to the aggregate transit graph and click add to widget etc. But that only creates a mini graph (which does show).
The nice front page graphs for Transit, Peering, and Transit and Peering are just white :(
Error! Filename not specified.
The Gap the graph below was from the upgrade maintenance as I also upgraded the distribution with apt upgrade etc.
Everything else seems ok
Thanks, Andy.
Sent from a teeny tiny keyboard, so please excuse typos
_______________________________________________ observium mailing list observium@observium.org mailto:observium@observium.org http://postman.memetic.org/cgi-bin/mailman/listinfo/observium
Hi Adam,
Ok, I can maybe help identify what is the other contributing factor then if you have been unable to replicate this?
Would you like me to send you a copy of my whole config.php?
It gets a little more complicated as some things are configured in the config.php, and some things in the web interface.
Generally the things that are set-in-stone are in the config.php, and the things that I’m happy for the team to tweek are left undefined in the config.php, thus allowing them to be edited in the web interface.
What would be the most useful thing for you?
Thanks again, Andy Lemin
Sent from a teeny tiny keyboard, so please excuse typos
On 7 Jan 2019, at 11:26, Adam Armstrong via observium <observium@observium.orgmailto:observium@observium.org> wrote:
Ahh yeah.
This was an issue we already found in rolling. I can’t actually replicate it on my system, though.
Adam.
From: observium <observium-bounces@observium.orgmailto:observium-bounces@observium.org> On Behalf Of Andrew Lemin via observium Sent: 07 January 2019 10:39 To: observium@observium.orgmailto:observium@observium.org Cc: Andrew Lemin <AndrewL@4d-dc.commailto:AndrewL@4d-dc.com>; McDonald Richards <mcdonald.richards@gmail.commailto:mcdonald.richards@gmail.com>; Adam Armstrong <adama@memetic.orgmailto:adama@memetic.org> Subject: Re: [Observium] Blank Dashboards
Hi Adam and list,
With the kind help from an old colleague (kudos Chris), who had the same issue, the problem was simply due to the existence of the following line in our config.php; $config['allow_unauth_graphs_cidr'] = array('10.0.0.0/8','172.16.0.0/12','192.168.0.0/16');
I know you only meant it in light jest, but you rather jumped the gun there Adam to blame things other than Observium 😉 Regardless of how long a new feature has been running for, there will always be entropy from different configurations out in the field.. And it can often take a long time for all the variants to float to the surface 😊
So as this has/is happening to others as well, it seems we can say with some confidence that the 'allow_unauth_graphs_cidr' property is broken now. Or at the very least, now has the opposite effect by reducing any elevated permissions.
Markus, for now until Adam can have a look at what is going on, just add a comment ‘#’ in front of this line in your config.php.
Thanks chaps, Andy Lemin
From: Markus Klock via observium <observium@observium.orgmailto:observium@observium.org> Reply-To: Markus Klock via observium <observium@observium.orgmailto:observium@observium.org> Date: Sunday, 6 January 2019 at 23:49 To: Markus Klock via observium <observium@observium.orgmailto:observium@observium.org> Cc: McDonald Richards <mcdonald.richards@gmail.commailto:mcdonald.richards@gmail.com>, Adam Armstrong <adama@memetic.orgmailto:adama@memetic.org> Subject: Re: [Observium] Blank Dashboards
I have the same issue this morning also -- widgets for the peering/transit traffic are empty boxes. Had not run an update since mid-December due to the vacation period.
Any helpful suggestions on why the widgets would not display data or debug information that can be provided?
On Mon, Jan 7, 2019 at 10:10 AM adama--- via observium <observium@observium.orgmailto:observium@observium.org> wrote: Shit corporate browser from 1973? Shit corporate firewall?
My money would be on those. :D
The new dashboard has been in rolling release for 2 months already.
Adam.
-------- Original Message -------- Subject: [Observium] Blank Dashboards From: Andrew Lemin via observium To: observium@observium.orgmailto:observium@observium.org CC: Andrew Lemin
Hi.
Has anyone else experienced the same issue where after the Observium upgrade (9657) the new dashboard is showing empty transit and peering traffic graphs?
Before the upgrade they were showing the traffic data fine, but on the new dashboard based front page, the graphs are empty?
I’ve cleared browser cache etc and waited for a while.
I have also tried adding a new graph, which involves browsing to the aggregate transit graph and click add to widget etc. But that only creates a mini graph (which does show).
The nice front page graphs for Transit, Peering, and Transit and Peering are just white :(
Error! Filename not specified. The Gap the graph below was from the upgrade maintenance as I also upgraded the distribution with apt upgrade etc.
Everything else seems ok
Thanks, Andy.
Sent from a teeny tiny keyboard, so please excuse typos _______________________________________________ observium mailing list observium@observium.orgmailto:observium@observium.org http://postman.memetic.org/cgi-bin/mailman/listinfo/observium _______________________________________________ observium mailing list observium@observium.orgmailto:observium@observium.org http://postman.memetic.org/cgi-bin/mailman/listinfo/observium
PS; I have found the table in the database.
Would you like me to send you both our config.php file and a dump of the config table?
Let me know if there are any other table dumps that would be helpful?
Cheers, A
From: Andrew Lemin AndrewL@4d-dc.com Date: Monday, 7 January 2019 at 15:23 To: Observium observium@observium.org Cc: Adam Armstrong adama@memetic.org Subject: Re: [Observium] Blank Dashboards
Hi Adam,
Ok, I can maybe help identify what is the other contributing factor then if you have been unable to replicate this?
Would you like me to send you a copy of my whole config.php?
It gets a little more complicated as some things are configured in the config.php, and some things in the web interface.
Generally the things that are set-in-stone are in the config.php, and the things that I’m happy for the team to tweek are left undefined in the config.php, thus allowing them to be edited in the web interface.
What would be the most useful thing for you?
Thanks again, Andy Lemin
Sent from a teeny tiny keyboard, so please excuse typos
On 7 Jan 2019, at 11:26, Adam Armstrong via observium <observium@observium.orgmailto:observium@observium.org> wrote: Ahh yeah.
This was an issue we already found in rolling. I can’t actually replicate it on my system, though.
Adam.
From: observium <observium-bounces@observium.orgmailto:observium-bounces@observium.org> On Behalf Of Andrew Lemin via observium Sent: 07 January 2019 10:39 To: observium@observium.orgmailto:observium@observium.org Cc: Andrew Lemin <AndrewL@4d-dc.commailto:AndrewL@4d-dc.com>; McDonald Richards <mcdonald.richards@gmail.commailto:mcdonald.richards@gmail.com>; Adam Armstrong <adama@memetic.orgmailto:adama@memetic.org> Subject: Re: [Observium] Blank Dashboards
Hi Adam and list,
With the kind help from an old colleague (kudos Chris), who had the same issue, the problem was simply due to the existence of the following line in our config.php; $config['allow_unauth_graphs_cidr'] = array('10.0.0.0/8','172.16.0.0/12','192.168.0.0/16');
I know you only meant it in light jest, but you rather jumped the gun there Adam to blame things other than Observium 😉 Regardless of how long a new feature has been running for, there will always be entropy from different configurations out in the field.. And it can often take a long time for all the variants to float to the surface 😊
So as this has/is happening to others as well, it seems we can say with some confidence that the 'allow_unauth_graphs_cidr' property is broken now. Or at the very least, now has the opposite effect by reducing any elevated permissions.
Markus, for now until Adam can have a look at what is going on, just add a comment ‘#’ in front of this line in your config.php.
Thanks chaps, Andy Lemin
From: Markus Klock via observium <observium@observium.orgmailto:observium@observium.org> Reply-To: Markus Klock via observium <observium@observium.orgmailto:observium@observium.org> Date: Sunday, 6 January 2019 at 23:49 To: Markus Klock via observium <observium@observium.orgmailto:observium@observium.org> Cc: McDonald Richards <mcdonald.richards@gmail.commailto:mcdonald.richards@gmail.com>, Adam Armstrong <adama@memetic.orgmailto:adama@memetic.org> Subject: Re: [Observium] Blank Dashboards
I have the same issue this morning also -- widgets for the peering/transit traffic are empty boxes. Had not run an update since mid-December due to the vacation period.
Any helpful suggestions on why the widgets would not display data or debug information that can be provided?
On Mon, Jan 7, 2019 at 10:10 AM adama--- via observium <observium@observium.orgmailto:observium@observium.org> wrote: Shit corporate browser from 1973? Shit corporate firewall?
My money would be on those. :D
The new dashboard has been in rolling release for 2 months already.
Adam.
-------- Original Message -------- Subject: [Observium] Blank Dashboards From: Andrew Lemin via observium To: observium@observium.orgmailto:observium@observium.org CC: Andrew Lemin
Hi.
Has anyone else experienced the same issue where after the Observium upgrade (9657) the new dashboard is showing empty transit and peering traffic graphs?
Before the upgrade they were showing the traffic data fine, but on the new dashboard based front page, the graphs are empty?
I’ve cleared browser cache etc and waited for a while.
I have also tried adding a new graph, which involves browsing to the aggregate transit graph and click add to widget etc. But that only creates a mini graph (which does show).
The nice front page graphs for Transit, Peering, and Transit and Peering are just white :(
Error! Filename not specified. The Gap the graph below was from the upgrade maintenance as I also upgraded the distribution with apt upgrade etc.
Everything else seems ok
Thanks, Andy.
Sent from a teeny tiny keyboard, so please excuse typos _______________________________________________ observium mailing list observium@observium.orgmailto:observium@observium.org http://postman.memetic.org/cgi-bin/mailman/listinfo/observium _______________________________________________ observium mailing list observium@observium.orgmailto:observium@observium.org http://postman.memetic.org/cgi-bin/mailman/listinfo/observium

Try https://your.observium/settings/format=changed_config/ and/or https://your.observium/settings/format=config/ ;-)
Tom
On 1/7/2019 4:30 PM, Andrew Lemin via observium wrote:
PS; I have found the table in the database.
Would you like me to send you both our config.php file and a dump of the config table?
Let me know if there are any other table dumps that would be helpful?
Cheers, A
*From: *Andrew Lemin AndrewL@4d-dc.com *Date: *Monday, 7 January 2019 at 15:23 *To: *Observium observium@observium.org *Cc: *Adam Armstrong adama@memetic.org *Subject: *Re: [Observium] Blank Dashboards
Hi Adam,
Ok, I can maybe help identify what is the other contributing factor then if you have been unable to replicate this?
Would you like me to send you a copy of my whole config.php?
It gets a little more complicated as some things are configured in the config.php, and some things in the web interface.
Generally the things that are set-in-stone are in the config.php, and the things that I’m happy for the team to tweek are left undefined in the config.php, thus allowing them to be edited in the web interface.
What would be the most useful thing for you?
Thanks again,
Andy Lemin
Sent from a teeny tiny keyboard, so please excuse typos
On 7 Jan 2019, at 11:26, Adam Armstrong via observium <observium@observium.org mailto:observium@observium.org> wrote:
Ahh yeah.

This was an issue we already found in rolling. I can’t actually
replicate it on my system, though.

Adam.

*From:*observium <observium-bounces@observium.org
<mailto:observium-bounces@observium.org>> *On Behalf Of *Andrew
Lemin via observium
*Sent:* 07 January 2019 10:39
*To:* observium@observium.org <mailto:observium@observium.org>
*Cc:* Andrew Lemin <AndrewL@4d-dc.com <mailto:AndrewL@4d-dc.com>>;
McDonald Richards <mcdonald.richards@gmail.com
<mailto:mcdonald.richards@gmail.com>>; Adam Armstrong
<adama@memetic.org <mailto:adama@memetic.org>>
*Subject:* Re: [Observium] Blank Dashboards

Hi Adam and list,

With the kind help from an old colleague (kudos Chris), who had
the same issue, the problem was simply due to the existence of the
following line in our config.php;

$config['allow_unauth_graphs_cidr'] =
array('10.0.0.0/8','172.16.0.0/12','192.168.0.0/16');

I know you only meant it in light jest, but you rather jumped the
gun there Adam to blame things other than Observium 😉

Regardless of how long a new feature has been running for, there
will always be entropy from different configurations out in the
field.. And it can often take a long time for all the variants to
float to the surface 😊

So as this has/is happening to others as well, it seems we can say
with some confidence that the 'allow_unauth_graphs_cidr' property
is broken now. Or at the very least, now has the opposite effect
by reducing any elevated permissions.

Markus, for now until Adam can have a look at what is going on,
just add a comment ‘#’ in front of this line in your config.php.

Thanks chaps, Andy Lemin

*From: *Markus Klock via observium <observium@observium.org
<mailto:observium@observium.org>>
*Reply-To: *Markus Klock via observium <observium@observium.org
<mailto:observium@observium.org>>
*Date: *Sunday, 6 January 2019 at 23:49
*To: *Markus Klock via observium <observium@observium.org
<mailto:observium@observium.org>>
*Cc: *McDonald Richards <mcdonald.richards@gmail.com
<mailto:mcdonald.richards@gmail.com>>, Adam Armstrong
<adama@memetic.org <mailto:adama@memetic.org>>
*Subject: *Re: [Observium] Blank Dashboards

I have the same issue this morning also -- widgets for the
peering/transit traffic are empty boxes. Had not run an update
since mid-December due to the vacation period.

Any helpful suggestions on why the widgets would not display data
or debug information that can be provided?

On Mon, Jan 7, 2019 at 10:10 AM adama--- via observium
<observium@observium.org <mailto:observium@observium.org>> wrote:

    Shit corporate browser from 1973? Shit corporate firewall?

    My money would be on those. :D

    The new dashboard has been in rolling release for 2 months
    already.

    Adam.


    -------- Original Message --------
    Subject: [Observium] Blank Dashboards
    From: Andrew Lemin via observium
    To: observium@observium.org <mailto:observium@observium.org>
    CC: Andrew Lemin


        Hi.

        Has anyone else experienced the same issue where after the
        Observium upgrade (9657) the new dashboard is showing
        empty transit and peering traffic graphs?

        Before the upgrade they were showing the traffic data
        fine, but on the new dashboard based front page, the
        graphs are empty?

        I’ve cleared browser cache etc and waited for a while.

        I have also tried adding a new graph, which involves
        browsing to the aggregate transit graph and click add to
        widget etc. But that only creates a mini graph (which does
        show).

        The nice front page graphs for Transit, Peering, and
        Transit and Peering are just white :(

        *Error! Filename not specified.*

        The Gap the graph below was from the upgrade maintenance
        as I also upgraded the distribution with apt upgrade etc.

        Everything else seems ok

        Thanks, Andy.

        Sent from a teeny tiny keyboard, so please excuse typos

    _______________________________________________
    observium mailing list
    observium@observium.org <mailto:observium@observium.org>
    http://postman.memetic.org/cgi-bin/mailman/listinfo/observium

_______________________________________________
observium mailing list
observium@observium.org <mailto:observium@observium.org>
http://postman.memetic.org/cgi-bin/mailman/listinfo/observium
observium mailing list observium@observium.org http://postman.memetic.org/cgi-bin/mailman/listinfo/observium
participants (7)
-
 Adam Armstrong
 -
adama@memetic.org
-
 Andrew Lemin
 -
 Cody Cook
 -
 McDonald Richards
 -
 McDonald Richards
 -
 Tom Laermans