
hi,
When we view the details of a switch (any brand) we can know which port is UP and which is DOWN.
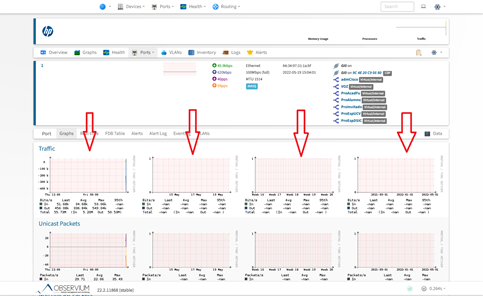
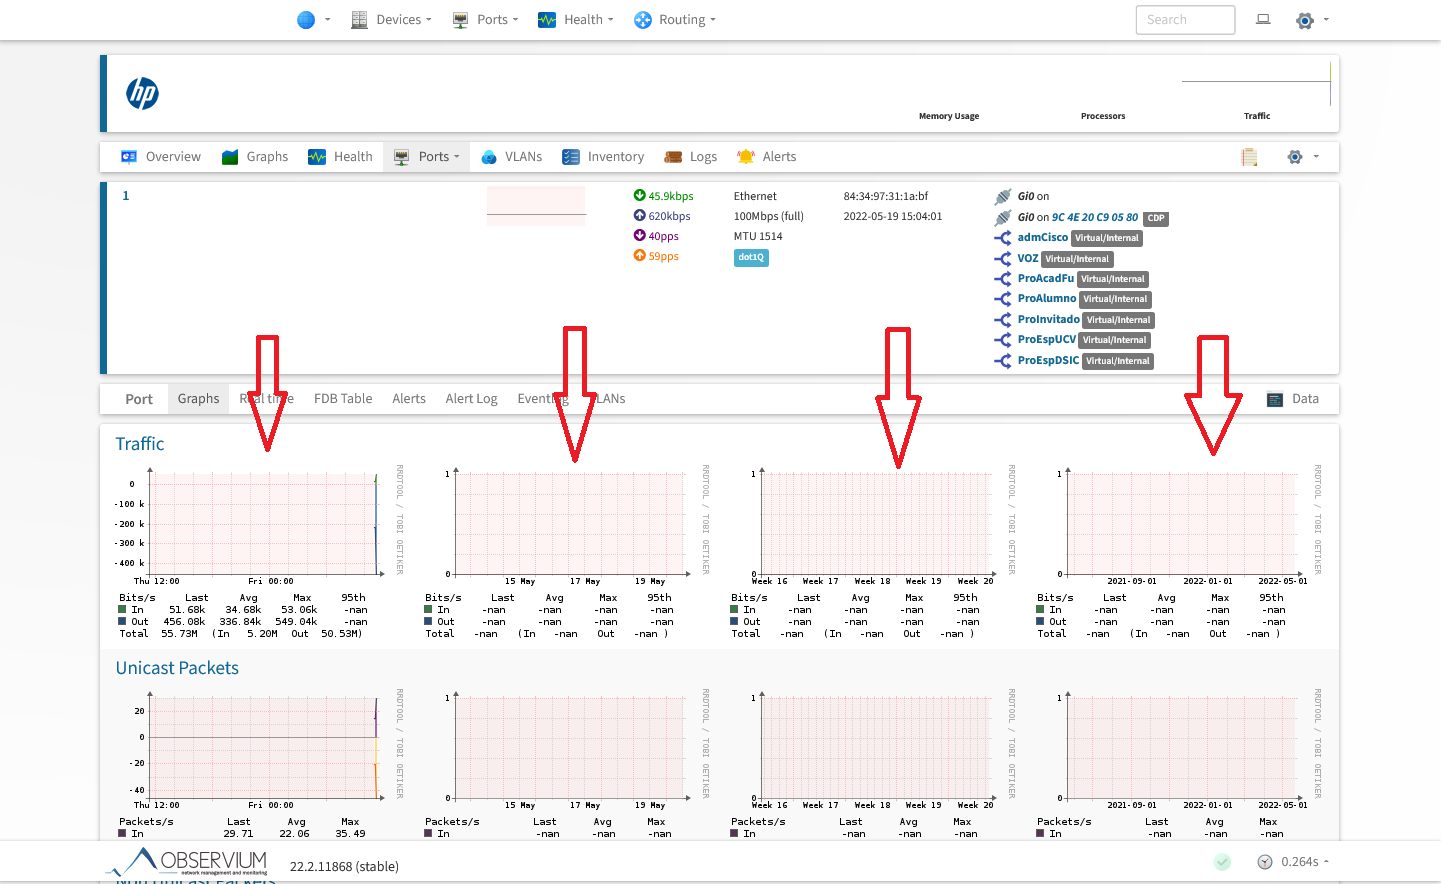
It is possible (somehow) to see summary charts for 1 day, 1 month, 1 year. ? without having to enter so many options... port, traffic, then traffic graphics... eg enter the port and there view the graphs of 1 day, 1 month and 1 year.
[image: image.png]

I don’t quite understand the question.
Adam.
From: observium observium-bounces@observium.org On Behalf Of Arnoldo Vidal Bravo via observium Sent: 20 May 2022 16:32 To: Observium observium@observium.org Cc: Arnoldo Vidal Bravo arnoldo.vidal@pucv.cl Subject: [Observium] (no subject)
hi,
When we view the details of a switch (any brand) we can know which port is UP and which is DOWN.
It is possible (somehow) to see summary charts for 1 day, 1 month, 1 year. ? without having to enter so many options... port, traffic, then traffic graphics... eg enter the port and there view the graphs of 1 day, 1 month and 1 year.

On the Ports -> Basic or Ports -> Details screen, the background colour of each row indicates the port status. Is that insufficient?
On the port page that you show, the red graphs are precisely where you should look for 1 day, 1 month, 1 year graphs. The red background indicates that Observium is not able to draw the graph yet, usually because there is no data to draw. The port you show is clearly up and running, so there should be SOME data – this means something else has broken in the back-end. Check your Observium logs, FPM logs, and webserver logs for errors.
-Adam
Adam Thompson Consultant, Infrastructure Services [MERLIN] 100 - 135 Innovation Drive Winnipeg, MB R3T 6A8 (204) 977-6824 or 1-800-430-6404 (MB only) https://www.merlin.mb.cahttps://www.merlin.mb.ca/ [cid:image002.png@01D86F83.671EA490]Chat with me on Teamshttps://teams.microsoft.com/l/chat/0/0?users=athompson@merlin.mb.ca
From: observium observium-bounces@observium.org On Behalf Of Arnoldo Vidal Bravo via observium Sent: Friday, May 20, 2022 10:32 AM To: Observium observium@observium.org Cc: Arnoldo Vidal Bravo arnoldo.vidal@pucv.cl Subject: [Observium] (no subject)
hi,
When we view the details of a switch (any brand) we can know which port is UP and which is DOWN.
It is possible (somehow) to see summary charts for 1 day, 1 month, 1 year. ? without having to enter so many options... port, traffic, then traffic graphics... eg enter the port and there view the graphs of 1 day, 1 month and 1 year.
[cid:image003.png@01D86F83.671EA490] --
Saluda cordialmente
[https://ci3.googleusercontent.com/mail-sig/AIorK4xw9To13FI5Xwc5N7FVE6Ti8oYYP...]
participants (3)
-
 Adam Armstrong
 -
 Adam Thompson
 -
 Arnoldo Vidal Bravo