issue with broken graph

Dear Members,
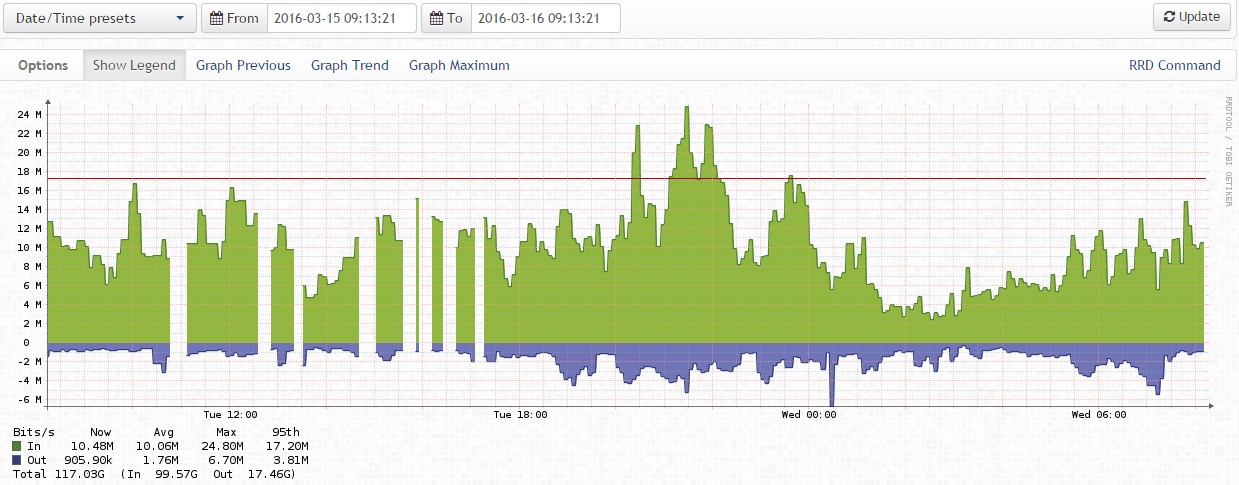
We are running latest commercial version and currently we have about 260 devices with 24 probers.
We are getting graph that is breaking up but the link is ok.
Anyone has any idea?
Thanks!
Regards, Edy

show me :
cat /etc/cron.d/observium
adam. On 23/03/2016 01:37:31, Pui Edylie email@edylie.net wrote: Dear Members,
We are running latest commercial version and currently we have about 260 devices with 24 probers.
We are getting graph that is breaking up but the link is ok.
Anyone has any idea?
Thanks!
Regards, Edy
33 */6 * * * root /opt/observium/discovery.php -h all >> /dev/null 2>&1 */5 * * * * root /opt/observium/discovery.php -h new >> /dev/null 2>&1 */5 * * * * root /opt/observium/poller-wrapper.py 24 >> /dev/null 2>&1
On 3/23/2016 9:46 AM, Adam Armstrong wrote:
show me :
cat /etc/cron.d/observium
adam.
On 23/03/2016 01:37:31, Pui Edylie email@edylie.net wrote:
Dear Members,
We are running latest commercial version and currently we have about 260 devices with 24 probers.
We are getting graph that is breaking up but the link is ok.
Anyone has any idea?
Thanks!
Regards, Edy
observium mailing list observium@observium.org http://postman.memetic.org/cgi-bin/mailman/listinfo/observium
Are you sure having 24 threads is a good idea?

Gaps like these are usually caused by network issues, or poller
processes getting stacked up and interfering with one another.

You can try using the new 'experimental' ports poller mode :

$config['enable_ports_separate_walk']   = 1;

You'll be able to see on the poller information screen if it's had
a positive/negative effect.

adam. On 23/03/2016 01:50:43, Pui Edylie email@edylie.net wrote: 33 */6 * * * root /opt/observium/discovery.php -h all >> /dev/null 2>&1 */5 * * * * root /opt/observium/discovery.php -h new >> /dev/null 2>&1 */5 * * * * root /opt/observium/poller-wrapper.py 24 >> /dev/null 2>&1
On 3/23/2016 9:46 AM, Adam Armstrong wrote:
show me :

cat /etc/cron.d/observium

adam. On 23/03/2016 01:37:31, Pui Edylie email@edylie.net [mailto:email@edylie.net] wrote: Dear Members,
We are running latest commercial version and currently we have about 260 devices with 24 probers.
We are getting graph that is breaking up but the link is ok.
Anyone has any idea?
Thanks!
Regards, Edy
_______________________________________________ observium mailing list observium@observium.org [mailto:observium@observium.org] http://postman.memetic.org/cgi-bin/mailman/listinfo/observium [http://postman.memetic.org/cgi-bin/mailman/listinfo/observium]
Hi Adam,
The reason why I increased it because I thought we were having too many devices thus the poller was not enough.
What would you recommend on the number of poller?
We have confirmed that there is no network issue on our end.
I have inserted $config['enable_ports_separate_walk'] = 1; into the config.php
Which poller screen are you referring to?
Thanks!
Regards, Edy
On 3/23/2016 9:53 AM, Adam Armstrong wrote:
Are you sure having 24 threads is a good idea?

Gaps like these are usually caused by network issues, or poller
processes getting stacked up and interfering with one another.

You can try using the new 'experimental' ports poller mode :

$config['enable_ports_separate_walk']   = 1;

You'll be able to see on the poller information screen if it's had
a positive/negative effect.

adam.
On 23/03/2016 01:50:43, Pui Edylie email@edylie.net wrote:
33 */6 * * * root /opt/observium/discovery.php -h all >> /dev/null 2>&1 */5 * * * * root /opt/observium/discovery.php -h new >> /dev/null 2>&1 */5 * * * * root /opt/observium/poller-wrapper.py 24 >> /dev/null 2>&1
On 3/23/2016 9:46 AM, Adam Armstrong wrote:
show me :

cat /etc/cron.d/observium

adam.
On 23/03/2016 01:37:31, Pui Edylie email@edylie.net wrote:
Dear Members,
We are running latest commercial version and currently we have about 260 devices with 24 probers.
We are getting graph that is breaking up but the link is ok.
Anyone has any idea?
Thanks!
Regards, Edy
observium mailing list observium@observium.org http://postman.memetic.org/cgi-bin/mailman/listinfo/observium
observium mailing list observium@observium.org http://postman.memetic.org/cgi-bin/mailman/listinfo/observium
It's impossible for me to tell you how many threads you should have. In general you should have enough to have the lowest constant load on the server, so basically enough that the poller_wrapper.py process takes ~300 seconds.
http://alpha.memetic.org/~adama/snaps/Observium_Dev____Poller_Discovery_Timi...
You'll see mine takes 400 seconds, but that's because i'm lazy and haven't bothered increasing the threads! :D
adam. On 23/03/2016 01:58:02, Pui Edylie email@edylie.net wrote: Hi Adam,
The reason why I increased it because I thought we were having too many devices thus the poller was not enough.
What would you recommend on the number of poller?
We have confirmed that there is no network issue on our end.
I have inserted $config['enable_ports_separate_walk'] = 1; into the config.php
Which poller screen are you referring to?
Thanks!
Regards, Edy
On 3/23/2016 9:53 AM, Adam Armstrong wrote:
Are you sure having 24 threads is a good idea?
Gaps like these are usually caused by network issues, or poller processes getting stacked up and interfering with one another.
You can try using the new 'experimental' ports poller mode :
$config['enable_ports_separate_walk'] = 1;
You'll be able to see on the poller information screen if it's had a positive/negative effect.
adam. On 23/03/2016 01:50:43, Pui Edylie email@edylie.net [mailto:email@edylie.net] wrote: 33 */6 * * * root /opt/observium/discovery.php -h all >> /dev/null 2>&1 */5 * * * * root /opt/observium/discovery.php -h new >> /dev/null 2>&1 */5 * * * * root /opt/observium/poller-wrapper.py 24 >> /dev/null 2>&1
On 3/23/2016 9:46 AM, Adam Armstrong wrote:
show me :
cat /etc/cron.d/observium
adam. On 23/03/2016 01:37:31, Pui Edylie email@edylie.net [mailto:email@edylie.net] [mailto:email@edylie.net] wrote: Dear Members,
We are running latest commercial version and currently we have about 260 devices with 24 probers.
We are getting graph that is breaking up but the link is ok.
Anyone has any idea?
Thanks!
Regards, Edy
_______________________________________________ observium mailing list observium@observium.org [mailto:observium@observium.org] http://postman.memetic.org/cgi-bin/mailman/listinfo/observium [http://postman.memetic.org/cgi-bin/mailman/listinfo/observium]
_______________________________________________ observium mailing list observium@observium.org [mailto:observium@observium.org] http://postman.memetic.org/cgi-bin/mailman/listinfo/observium [http://postman.memetic.org/cgi-bin/mailman/listinfo/observium]

One of our instances polls just over 200 devices (mostly in the same site) with 16 workers and completes in normally around 80 seconds.
[2016/03/22 21:56:28 -0400] poller-wrapper.py(21016): /opt/observium/poller-wrapper.py: polled 202 devices in 86 seconds with 16 workers
The VM runs on a Pure Storage SSD array though. Maybe try turning your pollers down? In the logs folder obvervium.log should tell you how long it's taking to poll all your devices, what do those average?
*Spencer Ryan* | Senior Systems Administrator | sryan@arbor.net *Arbor Networks* +1.734.794.5033 (d) | +1.734.846.2053 (m) www.arbornetworks.com
On Tue, Mar 22, 2016 at 9:53 PM, Adam Armstrong adama@memetic.org wrote:
Are you sure having 24 threads is a good idea?
Gaps like these are usually caused by network issues, or poller processes getting stacked up and interfering with one another.
You can try using the new 'experimental' ports poller mode :
$config['enable_ports_separate_walk'] = 1;
You'll be able to see on the poller information screen if it's had a positive/negative effect.
adam.
On 23/03/2016 01:50:43, Pui Edylie email@edylie.net wrote: 33 */6 * * * root /opt/observium/discovery.php -h all >> /dev/null 2>&1 */5 * * * * root /opt/observium/discovery.php -h new >> /dev/null 2>&1 */5 * * * * root /opt/observium/poller-wrapper.py 24 >> /dev/null 2>&1
On 3/23/2016 9:46 AM, Adam Armstrong wrote:
show me :
cat /etc/cron.d/observium
adam.
On 23/03/2016 01:37:31, Pui Edylie email@edylie.net email@edylie.net wrote: Dear Members,
We are running latest commercial version and currently we have about 260 devices with 24 probers.
We are getting graph that is breaking up but the link is ok.
Anyone has any idea?
Thanks!
Regards, Edy
observium mailing listobservium@observium.orghttp://postman.memetic.org/cgi-bin/mailman/listinfo/observium
observium mailing list observium@observium.org http://postman.memetic.org/cgi-bin/mailman/listinfo/observium
This data is slightly more accessible in the poller information page :)
SSD is pretty much a requirement for lots of threads, since most of our load is I/O!
adam. On 23/03/2016 01:59:11, Spencer Ryan sryan@arbor.net wrote: One of our instances polls just over 200 devices (mostly in the same site) with 16 workers and completes in normally around 80 seconds.
[2016/03/22 21:56:28 -0400] poller-wrapper.py(21016): /opt/observium/poller-wrapper.py: polled 202 devices in 86 seconds with 16 workers
The VM runs on a Pure Storage SSD array though. Maybe try turning your pollers down? In the logs folder obvervium.log should tell you how long it's taking to poll all your devices, what do those average?
Spencer Ryan | Senior Systems Administrator | sryan@arbor.net [mailto:sryan@arbor.net] Arbor Networks +1.734.794.5033 (d) | +1.734.846.2053 (m) www.arbornetworks.com [http://www.arbornetworks.com/]
On Tue, Mar 22, 2016 at 9:53 PM, Adam Armstrong <adama@memetic.org [mailto:adama@memetic.org]> wrote:
Are you sure having 24 threads is a good idea?
Gaps like these are usually caused by network issues, or poller processes getting stacked up and interfering with one another.
You can try using the new 'experimental' ports poller mode :
$config['enable_ports_separate_walk'] = 1;
You'll be able to see on the poller information screen if it's had a positive/negative effect.
adam. On 23/03/2016 01:50:43, Pui Edylie <email@edylie.net [mailto:email@edylie.net]> wrote: 33 */6 * * * root /opt/observium/discovery.php -h all >> /dev/null 2>&1 */5 * * * * root /opt/observium/discovery.php -h new >> /dev/null 2>&1 */5 * * * * root /opt/observium/poller-wrapper.py 24 >> /dev/null 2>&1
On 3/23/2016 9:46 AM, Adam Armstrong wrote:
show me :
cat /etc/cron.d/observium
adam. On 23/03/2016 01:37:31, Pui Edylie email@edylie.net [mailto:email@edylie.net] wrote: Dear Members,
We are running latest commercial version and currently we have about 260 devices with 24 probers.
We are getting graph that is breaking up but the link is ok.
Anyone has any idea?
Thanks!
Regards, Edy
_______________________________________________ observium mailing list observium@observium.org [mailto:observium@observium.org] http://postman.memetic.org/cgi-bin/mailman/listinfo/observium [http://postman.memetic.org/cgi-bin/mailman/listinfo/observium]
_______________________________________________ observium mailing list observium@observium.org [mailto:observium@observium.org] http://postman.memetic.org/cgi-bin/mailman/listinfo/observium [http://postman.memetic.org/cgi-bin/mailman/listinfo/observium]
_______________________________________________ observium mailing list observium@observium.org http://postman.memetic.org/cgi-bin/mailman/listinfo/observium
Dear Spencer,
Our storage is pretty fast ... i doubt it is related with disk IO issue.
Looking at observium.log i am seeing this
[2016/03/23 10:03:44 +0800] poller.php(13026): /opt/observium/poller.php: hostname-xxx - 1 devices polled in 118.3 secs [2016/03/23 10:03:45 +0800] poller.php(15743): /opt/observium/poller.php: hostname-xxx - 1 devices polled in 92.80 secs
Is there any error logs which would indicate that poller unable to probe the device due to unable to reach the network?
Thanks!
Regards, Edy
On 3/23/2016 9:58 AM, Spencer Ryan wrote:
One of our instances polls just over 200 devices (mostly in the same site) with 16 workers and completes in normally around 80 seconds.
[2016/03/22 21:56:28 -0400] poller-wrapper.py(21016): /opt/observium/poller-wrapper.py: polled 202 devices in 86 seconds with 16 workers
The VM runs on a Pure Storage SSD array though. Maybe try turning your pollers down? In the logs folder obvervium.log should tell you how long it's taking to poll all your devices, what do those average?
Spencer Ryan* | Senior Systems Administrator | sryan@arbor.net mailto:sryan@arbor.net *Arbor Networks* +1.734.794.5033 (d) | +1.734.846.2053 (m) www.arbornetworks.com http://www.arbornetworks.com/
On Tue, Mar 22, 2016 at 9:53 PM, Adam Armstrong <adama@memetic.org mailto:adama@memetic.org> wrote:
Are you sure having 24 threads is a good idea? Gaps like these are usually caused by network issues, or poller processes getting stacked up and interfering with one another. You can try using the new 'experimental' ports poller mode : $config['enable_ports_separate_walk'] = 1; You'll be able to see on the poller information screen if it's had a positive/negative effect. adam.On 23/03/2016 01:50:43, Pui Edylie <email@edylie.net <mailto:email@edylie.net>> wrote: 33 */6 * * * root /opt/observium/discovery.php -h all >> /dev/null 2>&1 */5 * * * * root /opt/observium/discovery.php -h new >> /dev/null 2>&1 */5 * * * * root /opt/observium/poller-wrapper.py 24 >> /dev/null 2>&1 On 3/23/2016 9:46 AM, Adam Armstrong wrote:show me : cat /etc/cron.d/observium adam.On 23/03/2016 01:37:31, Pui Edylie <email@edylie.net> <mailto:email@edylie.net> wrote: Dear Members, We are running latest commercial version and currently we have about 260 devices with 24 probers. We are getting graph that is breaking up but the link is ok. Anyone has any idea? Thanks! Regards, Edy_______________________________________________ observium mailing list observium@observium.org <mailto:observium@observium.org> http://postman.memetic.org/cgi-bin/mailman/listinfo/observium_______________________________________________ observium mailing list observium@observium.org <mailto:observium@observium.org> http://postman.memetic.org/cgi-bin/mailman/listinfo/observium
observium mailing list observium@observium.org http://postman.memetic.org/cgi-bin/mailman/listinfo/observium
You can see some data on this in the settings for the device.
http://alpha.memetic.org/~adama/snaps/Observium_Demosapito.morpeth.memetic.o...
adam. On 23/03/2016 02:06:50, Pui Edylie email@edylie.net wrote: Dear Spencer,
Our storage is pretty fast ... i doubt it is related with disk IO issue.
Looking at observium.log i am seeing this
[2016/03/23 10:03:44 +0800] poller.php(13026): /opt/observium/poller.php: hostname-xxx - 1 devices polled in 118.3 secs [2016/03/23 10:03:45 +0800] poller.php(15743): /opt/observium/poller.php: hostname-xxx - 1 devices polled in 92.80 secs
Is there any error logs which would indicate that poller unable to probe the device due to unable to reach the network?
Thanks!
Regards, Edy
On 3/23/2016 9:58 AM, Spencer Ryan wrote:
One of our instances polls just over 200 devices (mostly in the same site) with 16 workers and completes in normally around 80 seconds.
[2016/03/22 21:56:28 -0400] poller-wrapper.py(21016): /opt/observium/poller-wrapper.py: polled 202 devices in 86 seconds with 16 workers
The VM runs on a Pure Storage SSD array though. Maybe try turning your pollers down? In the logs folder obvervium.log should tell you how long it's taking to poll all your devices, what do those average?
Spencer Ryan | Senior Systems Administrator | sryan@arbor.net [mailto:sryan@arbor.net] Arbor Networks +1.734.794.5033 (d) | +1.734.846.2053 (m) www.arbornetworks.com [http://www.arbornetworks.com] [http://www.arbornetworks.com/]
On Tue, Mar 22, 2016 at 9:53 PM, Adam Armstrong <adama@memetic.org [mailto:adama@memetic.org]> wrote:
Are you sure having 24 threads is a good idea?
Gaps like these are usually caused by network issues, or poller processes getting stacked up and interfering with one another.
You can try using the new 'experimental' ports poller mode :
$config['enable_ports_separate_walk'] = 1;
You'll be able to see on the poller information screen if it's had a positive/negative effect.
adam. On 23/03/2016 01:50:43, Pui Edylie <email@edylie.net [mailto:email@edylie.net]> wrote: 33 */6 * * * root /opt/observium/discovery.php -h all >> /dev/null 2>&1 */5 * * * * root /opt/observium/discovery.php -h new >> /dev/null 2>&1 */5 * * * * root /opt/observium/poller-wrapper.py 24 >> /dev/null 2>&1
On 3/23/2016 9:46 AM, Adam Armstrong wrote:
show me :
cat /etc/cron.d/observium
adam. On 23/03/2016 01:37:31, Pui Edylie email@edylie.net [mailto:email@edylie.net] [mailto:email@edylie.net] wrote: Dear Members,
We are running latest commercial version and currently we have about 260 devices with 24 probers.
We are getting graph that is breaking up but the link is ok.
Anyone has any idea?
Thanks!
Regards, Edy
_______________________________________________ observium mailing list observium@observium.org [mailto:observium@observium.org] http://postman.memetic.org/cgi-bin/mailman/listinfo/observium [http://postman.memetic.org/cgi-bin/mailman/listinfo/observium]
_______________________________________________ observium mailing list observium@observium.org [mailto:observium@observium.org] http://postman.memetic.org/cgi-bin/mailman/listinfo/observium [http://postman.memetic.org/cgi-bin/mailman/listinfo/observium]
_______________________________________________ observium mailing list observium@observium.org [mailto:observium@observium.org] http://postman.memetic.org/cgi-bin/mailman/listinfo/observium [http://postman.memetic.org/cgi-bin/mailman/listinfo/observium]
Hi Guys,
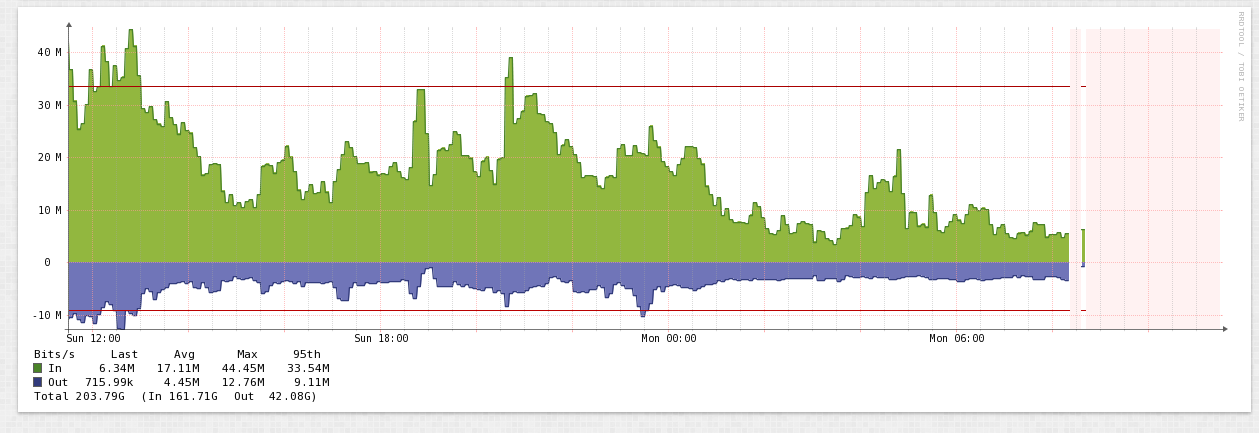
We are having the same broken graph issue again
I do not know why it shows the light red color. I can ping the device from Observium just fine.
I am seeing the following from the db.log
[2016/03/28 11:30:03 +0800] poller.php(1148): Failed dbQuery (#2006 - MySQL server has gone away), Query: INSERT INTO `snmp_errors` (`device_id`,`error_count`,`error_code`,`error_reason`,`snmp_cmd_exitcode`,`snmp_cmd`,`snmp_options`,`mib`,`mib_dir`,`oid`,`added`,`updated`) VALUES ('3','1','1002','Request timeout','1','snmpget','-OUQnv','','','.1.3.6.1.2.1.25.3.3.1.2.6','1459135803','1459135803') [2016/03/28 11:30:03 +0800] poller.php(1148): Failed dbQuery (#2006 - MySQL server has gone away), Query: UPDATE `processors-state` set `processor_usage` ='0',`processor_polled` ='1459135803' WHERE `processor_id` = '18' [2016/03/28 11:30:03 +0800] poller.php(9834): Failed dbQuery (#2006 - MySQL server has gone away), Query: SELECT * FROM `snmp_errors` WHERE `device_id` = '7' AND `error_code` = '1002' AND `snmp_cmd` = 'snmpget' AND `snmp_options` = '-Oqv' AND `mib` = 'HOST-RESOURCES-MIB' AND `oid` = 'hrSystemUptime.0';
I do not know why it says Mysql server has gone away as the process is running
[root@mrtg2 logs]# /etc/init.d/mysqld status mysqld (pid 11072) is running... [root@mrtg2 logs]# ps aux | grep mysqld root 10962 0.0 0.0 106064 1496 pts/0 S 11:28 0:00 /bin/sh /usr/bin/mysqld_safe --datadir=/var/lib/mysql --socket=/var/lib/mysql/mysql.sock --pid-file=/var/run/mysqld/mysqld.pid --basedir=/usr --user=mysql mysql 11072 1.1 0.5 2877776 40632 pts/0 Sl 11:28 0:02 /usr/libexec/mysqld --basedir=/usr --datadir=/var/lib/mysql --user=mysql --log-error=/var/log/mysqld.log --pid-file=/var/run/mysqld/mysqld.pid --socket=/var/lib/mysql/mysql.sock root 14263 0.0 0.0 103308 916 pts/0 S+ 11:31 0:00 grep mysqld
Any tips?
Thanks!
Regards, Edy
On 3/23/2016 9:58 AM, Spencer Ryan wrote:
One of our instances polls just over 200 devices (mostly in the same site) with 16 workers and completes in normally around 80 seconds.
[2016/03/22 21:56:28 -0400] poller-wrapper.py(21016): /opt/observium/poller-wrapper.py: polled 202 devices in 86 seconds with 16 workers
The VM runs on a Pure Storage SSD array though. Maybe try turning your pollers down? In the logs folder obvervium.log should tell you how long it's taking to poll all your devices, what do those average?
Spencer Ryan* | Senior Systems Administrator | sryan@arbor.net mailto:sryan@arbor.net *Arbor Networks* +1.734.794.5033 (d) | +1.734.846.2053 (m) www.arbornetworks.com http://www.arbornetworks.com/
On Tue, Mar 22, 2016 at 9:53 PM, Adam Armstrong <adama@memetic.org mailto:adama@memetic.org> wrote:
Are you sure having 24 threads is a good idea? Gaps like these are usually caused by network issues, or poller processes getting stacked up and interfering with one another. You can try using the new 'experimental' ports poller mode : $config['enable_ports_separate_walk'] = 1; You'll be able to see on the poller information screen if it's had a positive/negative effect. adam.On 23/03/2016 01:50:43, Pui Edylie <email@edylie.net <mailto:email@edylie.net>> wrote: 33 */6 * * * root /opt/observium/discovery.php -h all >> /dev/null 2>&1 */5 * * * * root /opt/observium/discovery.php -h new >> /dev/null 2>&1 */5 * * * * root /opt/observium/poller-wrapper.py 24 >> /dev/null 2>&1 On 3/23/2016 9:46 AM, Adam Armstrong wrote:show me : cat /etc/cron.d/observium adam.On 23/03/2016 01:37:31, Pui Edylie <email@edylie.net> <mailto:email@edylie.net> wrote: Dear Members, We are running latest commercial version and currently we have about 260 devices with 24 probers. We are getting graph that is breaking up but the link is ok. Anyone has any idea? Thanks! Regards, Edy_______________________________________________ observium mailing list observium@observium.org <mailto:observium@observium.org> http://postman.memetic.org/cgi-bin/mailman/listinfo/observium_______________________________________________ observium mailing list observium@observium.org <mailto:observium@observium.org> http://postman.memetic.org/cgi-bin/mailman/listinfo/observium
observium mailing list observium@observium.org http://postman.memetic.org/cgi-bin/mailman/listinfo/observium

MySQL was restarted while the poller was running,, as you can see in the processlist (start time 11:28)
Tol
On Mar 28, 2016 5:38 AM, Pui Edylie email@edylie.net wrote:
Hi Guys,
We are having the same broken graph issue again
I do not know why it shows the light red color. I can ping the device from Observium just fine.
I am seeing the following from the db.log
[2016/03/28 11:30:03 +0800] poller.php(1148): Failed dbQuery (#2006 - MySQL server has gone away), Query: INSERT INTO `snmp_errors` (`device_id`,`error_count`,`error_code`,`error_reason`,`snmp_cmd_exitcode`,`snmp_cmd`,`snmp_options`,`mib`,`mib_dir`,`oid`,`added`,`updated`) VALUES ('3','1','1002','Request timeout','1','snmpget','-OUQnv','','','.1.3.6.1.2.1.25.3.3.1.2.6','1459135803','1459135803') [2016/03/28 11:30:03 +0800] poller.php(1148): Failed dbQuery (#2006 - MySQL server has gone away), Query: UPDATE `processors-state` set `processor_usage` ='0',`processor_polled` ='1459135803' WHERE `processor_id` = '18' [2016/03/28 11:30:03 +0800] poller.php(9834): Failed dbQuery (#2006 - MySQL server has gone away), Query: SELECT * FROM `snmp_errors` WHERE `device_id` = '7' AND `error_code` = '1002' AND `snmp_cmd` = 'snmpget' AND `snmp_options` = '-Oqv' AND `mib` = 'HOST-RESOURCES-MIB' AND `oid` = 'hrSystemUptime.0';
I do not know why it says Mysql server has gone away as the process is running
[root@mrtg2 logs]# /etc/init.d/mysqld status mysqld (pid 11072) is running... [root@mrtg2 logs]# ps aux | grep mysqld root 10962 0.0 0.0 106064 1496 pts/0 S 11:28 0:00 /bin/sh /usr/bin/mysqld_safe --datadir=/var/lib/mysql --socket=/var/lib/mysql/mysql.sock --pid-file=/var/run/mysqld/mysqld.pid --basedir=/usr --user=mysql mysql 11072 1.1 0.5 2877776 40632 pts/0 Sl 11:28 0:02 /usr/libexec/mysqld --basedir=/usr --datadir=/var/lib/mysql --user=mysql --log-error=/var/log/mysqld.log --pid-file=/var/run/mysqld/mysqld.pid --socket=/var/lib/mysql/mysql.sock root 14263 0.0 0.0 103308 916 pts/0 S+ 11:31 0:00 grep mysqld
Any tips?
Thanks!
Regards, Edy
On 3/23/2016 9:58 AM, Spencer Ryan wrote:
One of our instances polls just over 200 devices (mostly in the same site) with 16 workers and completes in normally around 80 seconds.
[2016/03/22 21:56:28 -0400] poller-wrapper.py(21016): /opt/observium/poller-wrapper.py: polled 202 devices in 86 seconds with 16 workers
The VM runs on a Pure Storage SSD array though. Maybe try turning your pollers down? In the logs folder obvervium.log should tell you how long it's taking to poll all your devices, what do those average?
Spencer Ryan | Senior Systems Administrator | sryan@arbor.net
Arbor Networks
+1.734.794.5033 (d) | +1.734.846.2053 (m)
www.arbornetworks.com
On Tue, Mar 22, 2016 at 9:53 PM, Adam Armstrong adama@memetic.org wrote:
Are you sure having 24 threads is a good idea?
Gaps like these are usually caused by network issues, or poller processes getting stacked up and interfering with one another.
You can try using the new 'experimental' ports poller mode :
$config['enable_ports_separate_walk'] = 1;
You'll be able to see on the poller information screen if it's had a positive/negative effect.
adam.
On 23/03/2016 01:50:43, Pui Edylie email@edylie.net wrote:
33 */6 * * * root /opt/observium/discovery.php -h all >> /dev/null 2>&1 */5 * * * * root /opt/observium/discovery.php -h new >> /dev/null 2>&1 */5 * * * * root /opt/observium/poller-wrapper.py 24 >> /dev/null 2>&1
On 3/23/2016 9:46 AM, Adam Armstrong wrote:
show me :
cat /etc/cron.d/observium
adam.
On 23/03/2016 01:37:31, Pui Edylie email@edylie.net wrote:
Dear Members,
We are running latest commercial version and currently we have about 260 devices with 24 probers.
We are getting graph that is breaking up but the link is ok.
Anyone has any idea?
Thanks!
Regards, Edy
_______________________________________________ observium mailing list observium@observium.org http://postman.memetic.org/cgi-bin/mailman/listinfo/observium
_______________________________________________ observium mailing list observium@observium.org http://postman.memetic.org/cgi-bin/mailman/listinfo/observium
_______________________________________________ observium mailing list observium@observium.org http://postman.memetic.org/cgi-bin/mailman/listinfo/observium
participants (4)
-
 Adam Armstrong
 -
 Pui Edylie
 -
 Spencer Ryan
 -
 Tom Laermans