
Dear All,
Per noticed in monthly or yearly graph, I saw there are two data type in as picture bellow
Could anyone explain to me what is different between these two(I draw a red and blue line in attached picture) data which one is the correct data?
[image: Inline image 2]
Thanks for your explanation.

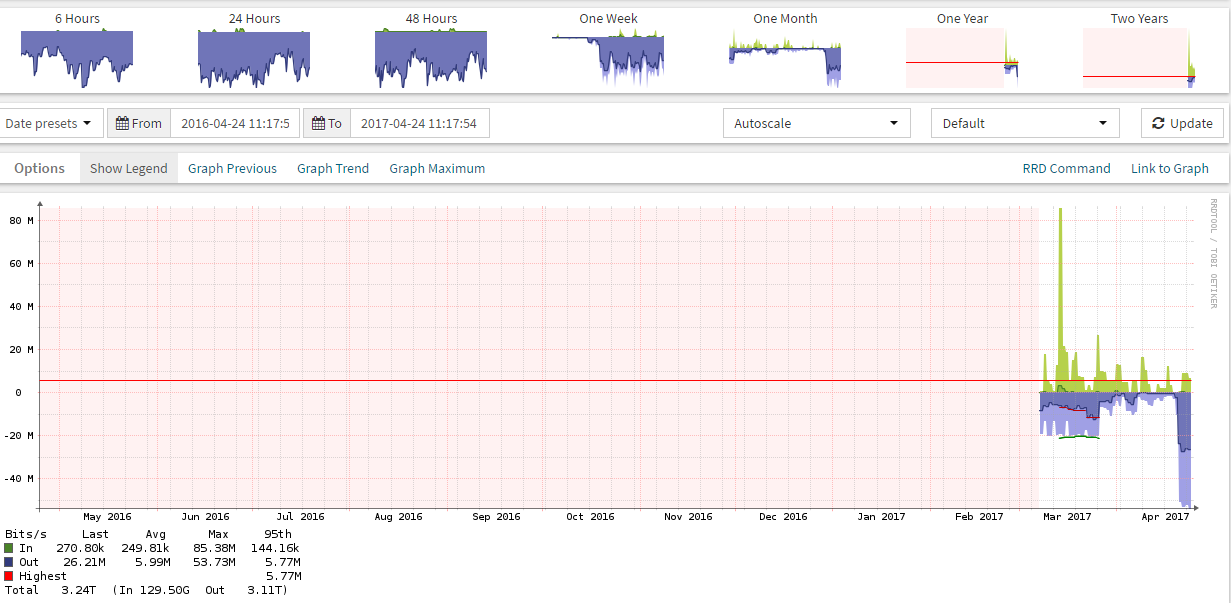
Your lines are red and green. In any event, maximum and average. As per the key. On Sun, Apr 23, 2017 at 9:27 PM Sophanith Chhom sophanith.chhom@gmail.com wrote:
Dear All,
Per noticed in monthly or yearly graph, I saw there are two data type in as picture bellow
Could anyone explain to me what is different between these two(I draw a red and blue line in attached picture) data which one is the correct data?
[image: Inline image 2]
Thanks for your explanation.
observium mailing list observium@observium.org http://postman.memetic.org/cgi-bin/mailman/listinfo/observium
participants (2)
-
 Michael Loftis
 -
 Sophanith Chhom