Alert chekers entites 'disapearing'

Hello,
I've created alarm checker:
os equals nxos hostname match *NET*
ifType equals ethernetCsmacd ifAlias match *vPC Keep-alive link*
And after a while i noticed that some entities where disapeared. The device was reachable and etc. I did a "rebuild' and they're reappeared again. What could be the cause ? NXOS ? :)

Hi,
Alert (and group) associations are rebuilt directly after a device discovery, so if during a discovery some ports are removed or their ifType/ifAlias is returned black because of timed out snmp, they'll drop off this checker.
Do you see the ifType/Alias being changed in the entity's logs?
adam. On 2017-12-12 13:09:15, Edvinas K edvinas.email@gmail.com wrote: Hello,
I've created alarm checker:
os equals nxos hostname match *NET*
ifType equals ethernetCsmacd ifAlias match *vPC Keep-alive link*
And after a while i noticed that some entities where disapeared. The device was reachable and etc. I did a "rebuild' and they're reappeared again. What could be the cause ? NXOS ? :) _______________________________________________ observium mailing list observium@observium.org http://postman.memetic.org/cgi-bin/mailman/listinfo/observium
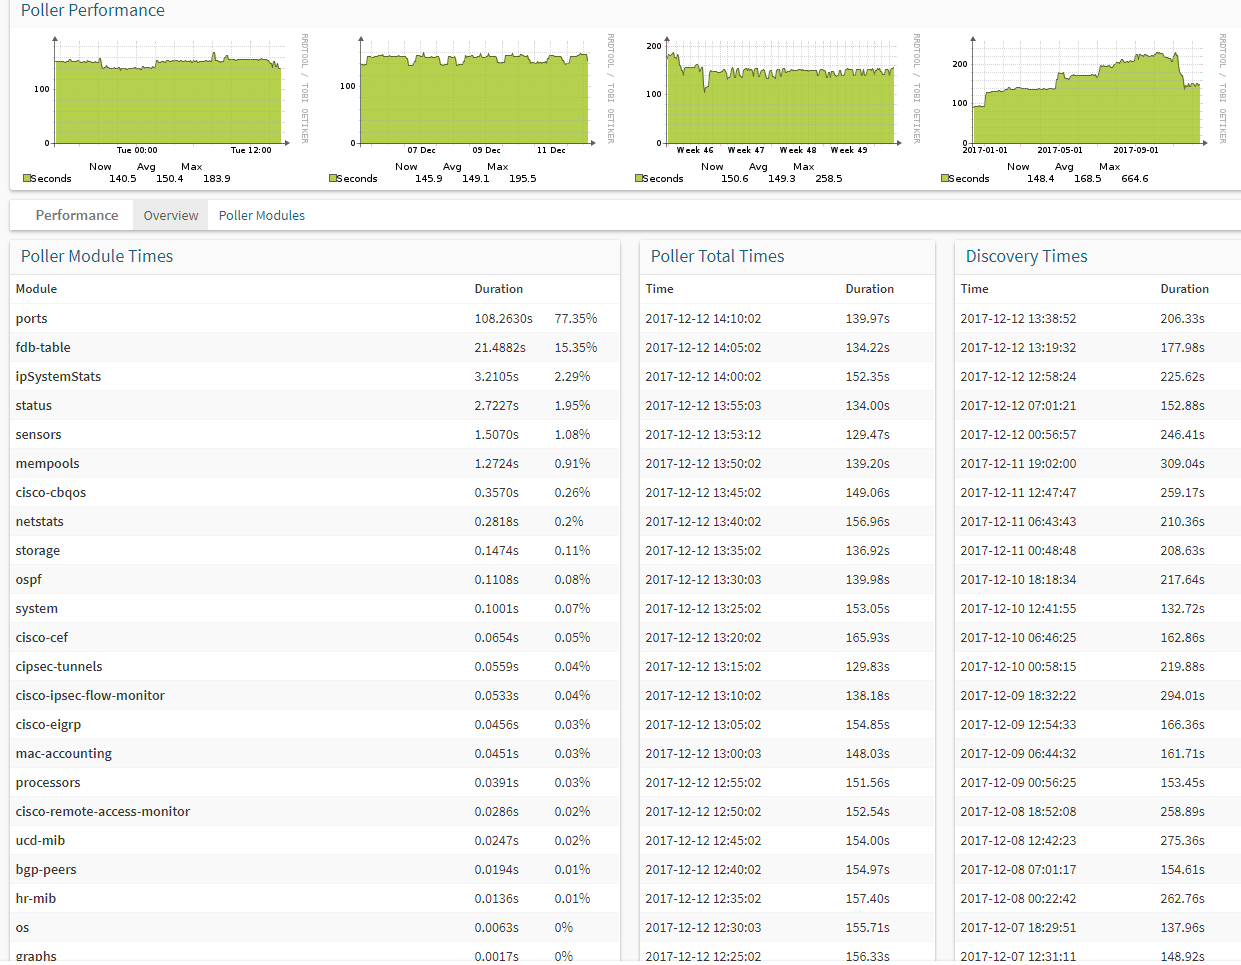
I did a manual discover (Discovery time - 206.3) but it still marked as deleted:
2017-12-12 14:42:05 Interface was marked as DELETED < after my discover. 2017-12-12 14:26:32 Interface DELETED mark removed 2017-12-12 14:22:16 Interface was marked as DELETED 2017-12-12 14:06:33 Interface DELETED mark removed 2017-12-12 14:01:56 Interface was marked as DELETED 2017-12-12 09:56:36 Interface changed: [ifAlias] '' -> 'vPC Keep-alive link'
What's wrong ?
On Tue, Dec 12, 2017 at 3:22 PM, Adam Armstrong adama@observium.org wrote:
Hi,
Alert (and group) associations are rebuilt directly after a device discovery, so if during a discovery some ports are removed or their ifType/ifAlias is returned black because of timed out snmp, they'll drop off this checker.
Do you see the ifType/Alias being changed in the entity's logs?
adam.
On 2017-12-12 13:09:15, Edvinas K edvinas.email@gmail.com wrote: Hello,
I've created alarm checker:
os equals nxos hostname match *NET*
ifType equals ethernetCsmacd ifAlias match *vPC Keep-alive link*
And after a while i noticed that some entities where disapeared. The device was reachable and etc. I did a "rebuild' and they're reappeared again. What could be the cause ? NXOS ? :) _______________________________________________ observium mailing list observium@observium.org http://postman.memetic.org/ cgi-bin/mailman/listinfo/observium
observium mailing list observium@observium.org http://postman.memetic.org/cgi-bin/mailman/listinfo/observium

Can you screenshot the Performance Data of that device? Cog-wheel at the top right on the device-page. Cisco Nexus have a pretty bad SNMP-stack. /Markus
2017-12-12 14:45 GMT+01:00 Edvinas K edvinas.email@gmail.com:
I did a manual discover (Discovery time - 206.3) but it still marked as deleted:
2017-12-12 14:42:05 Interface was marked as DELETED < after my discover. 2017-12-12 14:26:32 Interface DELETED mark removed 2017-12-12 14:22:16 Interface was marked as DELETED 2017-12-12 14:06:33 Interface DELETED mark removed 2017-12-12 14:01:56 Interface was marked as DELETED 2017-12-12 09:56:36 Interface changed: [ifAlias] '' -> 'vPC Keep-alive link'
What's wrong ?
On Tue, Dec 12, 2017 at 3:22 PM, Adam Armstrong adama@observium.org wrote:
Hi,
Alert (and group) associations are rebuilt directly after a device discovery, so if during a discovery some ports are removed or their ifType/ifAlias is returned black because of timed out snmp, they'll drop off this checker.
Do you see the ifType/Alias being changed in the entity's logs?
adam.
On 2017-12-12 13:09:15, Edvinas K edvinas.email@gmail.com wrote: Hello,
I've created alarm checker:
os equals nxos hostname match *NET*
ifType equals ethernetCsmacd ifAlias match *vPC Keep-alive link*
And after a while i noticed that some entities where disapeared. The device was reachable and etc. I did a "rebuild' and they're reappeared again. What could be the cause ? NXOS ? :) _______________________________________________ observium mailing list observium@observium.org http://postman.memetic.org/cgi -bin/mailman/listinfo/observium
observium mailing list observium@observium.org http://postman.memetic.org/cgi-bin/mailman/listinfo/observium
observium mailing list observium@observium.org http://postman.memetic.org/cgi-bin/mailman/listinfo/observium
I did a manual poller-wrapper and sicovery on it - but still, i dont see a port (entity) in alert checker.
Alo attaching a Screenshot:
[image: Inline image 1]
On Tue, Dec 12, 2017 at 3:58 PM, Markus Klock markus@best-practice.se wrote:
Can you screenshot the Performance Data of that device? Cog-wheel at the top right on the device-page. Cisco Nexus have a pretty bad SNMP-stack. /Markus
2017-12-12 14:45 GMT+01:00 Edvinas K edvinas.email@gmail.com:
I did a manual discover (Discovery time - 206.3) but it still marked as deleted:
2017-12-12 14:42:05 Interface was marked as DELETED < after my discover. 2017-12-12 14:26:32 Interface DELETED mark removed 2017-12-12 14:22:16 Interface was marked as DELETED 2017-12-12 14:06:33 Interface DELETED mark removed 2017-12-12 14:01:56 Interface was marked as DELETED 2017-12-12 09:56:36 Interface changed: [ifAlias] '' -> 'vPC Keep-alive link'
What's wrong ?
On Tue, Dec 12, 2017 at 3:22 PM, Adam Armstrong adama@observium.org wrote:
Hi,
Alert (and group) associations are rebuilt directly after a device discovery, so if during a discovery some ports are removed or their ifType/ifAlias is returned black because of timed out snmp, they'll drop off this checker.
Do you see the ifType/Alias being changed in the entity's logs?
adam.
On 2017-12-12 13:09:15, Edvinas K edvinas.email@gmail.com wrote: Hello,
I've created alarm checker:
os equals nxos hostname match *NET*
ifType equals ethernetCsmacd ifAlias match *vPC Keep-alive link*
And after a while i noticed that some entities where disapeared. The device was reachable and etc. I did a "rebuild' and they're reappeared again. What could be the cause ? NXOS ? :) _______________________________________________ observium mailing list observium@observium.org http://postman.memetic.org/cgi -bin/mailman/listinfo/observium
observium mailing list observium@observium.org http://postman.memetic.org/cgi-bin/mailman/listinfo/observium
observium mailing list observium@observium.org http://postman.memetic.org/cgi-bin/mailman/listinfo/observium
observium mailing list observium@observium.org http://postman.memetic.org/cgi-bin/mailman/listinfo/observium
and no eventlog entry about snmpwalk timeout?
/Markus
2017-12-12 15:21 GMT+01:00 Edvinas K edvinas.email@gmail.com:
I did a manual poller-wrapper and sicovery on it - but still, i dont see a port (entity) in alert checker.
Alo attaching a Screenshot:
[image: Inline image 1]
On Tue, Dec 12, 2017 at 3:58 PM, Markus Klock markus@best-practice.se wrote:
Can you screenshot the Performance Data of that device? Cog-wheel at the top right on the device-page. Cisco Nexus have a pretty bad SNMP-stack. /Markus
2017-12-12 14:45 GMT+01:00 Edvinas K edvinas.email@gmail.com:
I did a manual discover (Discovery time - 206.3) but it still marked as deleted:
2017-12-12 14:42:05 Interface was marked as DELETED < after my discover. 2017-12-12 14:26:32 Interface DELETED mark removed 2017-12-12 14:22:16 Interface was marked as DELETED 2017-12-12 14:06:33 Interface DELETED mark removed 2017-12-12 14:01:56 Interface was marked as DELETED 2017-12-12 09:56:36 Interface changed: [ifAlias] '' -> 'vPC Keep-alive link'
What's wrong ?
On Tue, Dec 12, 2017 at 3:22 PM, Adam Armstrong adama@observium.org wrote:
Hi,
Alert (and group) associations are rebuilt directly after a device discovery, so if during a discovery some ports are removed or their ifType/ifAlias is returned black because of timed out snmp, they'll drop off this checker.
Do you see the ifType/Alias being changed in the entity's logs?
adam.
On 2017-12-12 13:09:15, Edvinas K edvinas.email@gmail.com wrote: Hello,
I've created alarm checker:
os equals nxos hostname match *NET*
ifType equals ethernetCsmacd ifAlias match *vPC Keep-alive link*
And after a while i noticed that some entities where disapeared. The device was reachable and etc. I did a "rebuild' and they're reappeared again. What could be the cause ? NXOS ? :) _______________________________________________ observium mailing list observium@observium.org http://postman.memetic.org/cgi -bin/mailman/listinfo/observium
observium mailing list observium@observium.org http://postman.memetic.org/cgi-bin/mailman/listinfo/observium
observium mailing list observium@observium.org http://postman.memetic.org/cgi-bin/mailman/listinfo/observium
observium mailing list observium@observium.org http://postman.memetic.org/cgi-bin/mailman/listinfo/observium
observium mailing list observium@observium.org http://postman.memetic.org/cgi-bin/mailman/listinfo/observium
/opt/observium/poller-wrapper.py --host jayxxx /opt/observium/poller-wrapper.py:568: Warning: Data truncated for column 'process_name' at row 1 cursor.execute(p_query, (pid,ppid,processname,uid,command,s_time)) INFO: starting the poller at 2017/12/12 15:29:01 with 16 threads /usr/bin/env php /opt/observium/poller.php -q -h 223 >> /dev/null 2>&1 INFO: starting alerter.php for 223 INFO: finished alerter.php for 223 INFO: worker Thread-1 finished device 223 in 141 seconds INFO: poller-wrapper.py poller --host jayxxx processed 1 devices in 141.60 seconds with 16 threads, load average (5min) 1.95
Number of rows updated: 1
here the observium.log information:
infra [root@observ001prvitx logs]# cat observium.log | grep jayxxx | tail -30 [2017/12/12 12:27:38 +0000] poller.php(26069): /opt/observium/poller.php: jayxxx - 1 devices polled in 156.5 secs [2017/12/12 12:32:38 +0000] poller.php(27576): /opt/observium/poller.php: jayxxx - 1 devices polled in 155.8 secs [2017/12/12 12:37:39 +0000] poller.php(24853): /opt/observium/poller.php: jayxxx - 1 devices polled in 157.5 secs [2017/12/12 12:42:36 +0000] poller.php(31743): /opt/observium/poller.php: jayxxx - 1 devices polled in 155.1 secs [2017/12/12 12:47:35 +0000] poller.php(918): /opt/observium/poller.php: jayxxx - 1 devices polled in 154.1 secs [2017/12/12 12:52:34 +0000] poller.php(2685): /opt/observium/poller.php: jayxxx - 1 devices polled in 152.7 secs [2017/12/12 12:57:33 +0000] poller.php(6267): /opt/observium/poller.php: jayxxx - 1 devices polled in 151.7 secs [2017/12/12 13:02:30 +0000] poller.php(11093): /opt/observium/poller.php: jayxxx - 1 devices polled in 148.2 secs [2017/12/12 13:07:37 +0000] poller.php(14342): /opt/observium/poller.php: jayxxx - 1 devices polled in 155.0 secs [2017/12/12 13:12:20 +0000] poller.php(17116): /opt/observium/poller.php: jayxxx - 1 devices polled in 138.3 secs [2017/12/12 13:17:12 +0000] poller.php(18797): /opt/observium/poller.php: jayxxx - 1 devices polled in 129.9 secs [2017/12/12 13:22:29 +0000] discovery.php(18423): /opt/observium/discovery.php: jayxxx - 1 devices discovered in 178.5 secs [2017/12/12 13:22:47 +0000] poller.php(25318): /opt/observium/poller.php: jayxxx - 1 devices polled in 166.0 secs [2017/12/12 13:27:35 +0000] poller.php(27070): /opt/observium/poller.php: jayxxx - 1 devices polled in 153.2 secs [2017/12/12 13:32:22 +0000] poller.php(28740): /opt/observium/poller.php: jayxxx - 1 devices polled in 140.1 secs [2017/12/12 13:37:19 +0000] poller.php(31747): /opt/observium/poller.php: jayxxx - 1 devices polled in 137.1 secs [2017/12/12 13:42:18 +0000] discovery.php(14545): /opt/observium/discovery.php: jayxxx - 1 devices discovered in 206.4 secs [2017/12/12 13:42:39 +0000] poller.php(2225): /opt/observium/poller.php: jayxxx - 1 devices polled in 157.0 secs [2017/12/12 13:47:31 +0000] poller.php(5992): /opt/observium/poller.php: jayxxx - 1 devices polled in 149.2 secs [2017/12/12 13:52:21 +0000] poller.php(8767): /opt/observium/poller.php: jayxxx - 1 devices polled in 139.3 secs [2017/12/12 13:55:21 +0000] poller.php(18678): /opt/observium/poller.php: jayxxx - 1 devices polled in 129.5 secs [2017/12/12 13:57:16 +0000] poller.php(10836): /opt/observium/poller.php: jayxxx - 1 devices polled in 134.1 secs [2017/12/12 14:02:34 +0000] poller.php(14434): /opt/observium/poller.php: jayxxx - 1 devices polled in 152.4 secs [2017/12/12 14:07:16 +0000] poller.php(16199): /opt/observium/poller.php: jayxxx - 1 devices polled in 134.4 secs [2017/12/12 14:12:22 +0000] poller.php(18143): /opt/observium/poller.php: jayxxx - 1 devices polled in 140.1 secs [2017/12/12 14:17:17 +0000] poller.php(19794): /opt/observium/poller.php: jayxxx - 1 devices polled in 134.8 secs [2017/12/12 14:22:20 +0000] poller.php(22296): /opt/observium/poller.php: jayxxx - 1 devices polled in 138.0 secs [2017/12/12 14:27:13 +0000] poller.php(25090): /opt/observium/poller.php: jayxxx - 1 devices polled in 131.4 secs [2017/12/12 14:31:22 +0000] poller.php(9089): /opt/observium/poller.php: jayxxx - 1 devices polled in 141.0 secs [2017/12/12 14:32:30 +0000] poller.php(26759): /opt/observium/poller.php: jayxxx - 1 devices polled in 148.5 secs infra [root@observ001prvitx logs]#
On Tue, Dec 12, 2017 at 4:26 PM, Markus Klock markus@best-practice.se wrote:
and no eventlog entry about snmpwalk timeout?
/Markus
2017-12-12 15:21 GMT+01:00 Edvinas K edvinas.email@gmail.com:
I did a manual poller-wrapper and sicovery on it - but still, i dont see a port (entity) in alert checker.
Alo attaching a Screenshot:
[image: Inline image 1]
On Tue, Dec 12, 2017 at 3:58 PM, Markus Klock markus@best-practice.se wrote:
Can you screenshot the Performance Data of that device? Cog-wheel at the top right on the device-page. Cisco Nexus have a pretty bad SNMP-stack. /Markus
2017-12-12 14:45 GMT+01:00 Edvinas K edvinas.email@gmail.com:
I did a manual discover (Discovery time - 206.3) but it still marked as deleted:
2017-12-12 14:42:05 Interface was marked as DELETED < after my discover. 2017-12-12 14:26:32 Interface DELETED mark removed 2017-12-12 14:22:16 Interface was marked as DELETED 2017-12-12 14:06:33 Interface DELETED mark removed 2017-12-12 14:01:56 Interface was marked as DELETED 2017-12-12 09:56:36 Interface changed: [ifAlias] '' -> 'vPC Keep-alive link'
What's wrong ?
On Tue, Dec 12, 2017 at 3:22 PM, Adam Armstrong adama@observium.org wrote:
Hi,
Alert (and group) associations are rebuilt directly after a device discovery, so if during a discovery some ports are removed or their ifType/ifAlias is returned black because of timed out snmp, they'll drop off this checker.
Do you see the ifType/Alias being changed in the entity's logs?
adam.
On 2017-12-12 13:09:15, Edvinas K edvinas.email@gmail.com wrote: Hello,
I've created alarm checker:
os equals nxos hostname match *NET*
ifType equals ethernetCsmacd ifAlias match *vPC Keep-alive link*
And after a while i noticed that some entities where disapeared. The device was reachable and etc. I did a "rebuild' and they're reappeared again. What could be the cause ? NXOS ? :) _______________________________________________ observium mailing list observium@observium.org http://postman.memetic.org/cgi -bin/mailman/listinfo/observium
observium mailing list observium@observium.org http://postman.memetic.org/cgi-bin/mailman/listinfo/observium
observium mailing list observium@observium.org http://postman.memetic.org/cgi-bin/mailman/listinfo/observium
observium mailing list observium@observium.org http://postman.memetic.org/cgi-bin/mailman/listinfo/observium
observium mailing list observium@observium.org http://postman.memetic.org/cgi-bin/mailman/listinfo/observium
observium mailing list observium@observium.org http://postman.memetic.org/cgi-bin/mailman/listinfo/observium
so where coud be a problem ?
Poller.php polls in quite normal time:
[2017/12/13 07:37:30 +0000] poller.php(28605): /opt/observium/poller.php: jaynetxxx - 1 devices polled in 148.7 secs [2017/12/13 07:42:22 +0000] poller.php(30304): /opt/observium/poller.php: jaynetxxx - 1 devices polled in 140.3 secs [2017/12/13 07:47:28 +0000] poller.php(2525): /opt/observium/poller.php: jaynetxxx - 1 devices polled in 147.1 secs [2017/12/13 07:52:27 +0000] poller.php(6010): /opt/observium/poller.php: jaynetxxx - 1 devices polled in 145.6 secs
Disovery process (which is snmpwalk ?) completes the job in: 235.2 seconds
Device SNMP seetings: Max repetitions is set to: 20 .
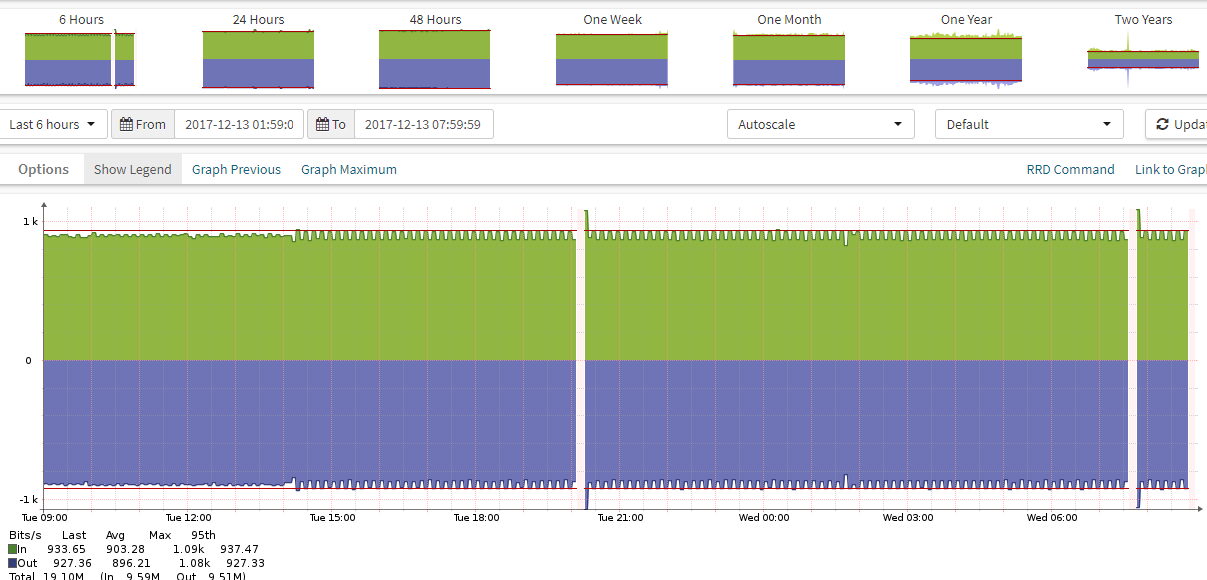
For example the the port is marked as deleted:
but the traffic graphs are still shown:
[image: Inline image 1]
When device is discovering (discovery -h) im seeing that the particular port is on:
| Protocol | ifName | Remote: hostname | port | platform | version | +----------+------------------+--------------------------------------+-------------------------+----------------------+------------------------------------------+ | CDP | mgmt0 | JAYNET01A | mgmt0 | N5K-C5548UP | Cisco Nexus Operating System (NX-OS) ... |
So where could be the problem ?
On Tue, Dec 12, 2017 at 4:33 PM, Edvinas K edvinas.email@gmail.com wrote:
/opt/observium/poller-wrapper.py --host jayxxx /opt/observium/poller-wrapper.py:568: Warning: Data truncated for column 'process_name' at row 1 cursor.execute(p_query, (pid,ppid,processname,uid,command,s_time)) INFO: starting the poller at 2017/12/12 15:29:01 with 16 threads /usr/bin/env php /opt/observium/poller.php -q -h 223 >> /dev/null 2>&1 INFO: starting alerter.php for 223 INFO: finished alerter.php for 223 INFO: worker Thread-1 finished device 223 in 141 seconds INFO: poller-wrapper.py poller --host jayxxx processed 1 devices in 141.60 seconds with 16 threads, load average (5min) 1.95
Number of rows updated: 1
here the observium.log information:
infra [root@observ001prvitx logs]# cat observium.log | grep jayxxx | tail -30 [2017/12/12 12:27:38 +0000] poller.php(26069): /opt/observium/poller.php: jayxxx - 1 devices polled in 156.5 secs [2017/12/12 12:32:38 +0000] poller.php(27576): /opt/observium/poller.php: jayxxx - 1 devices polled in 155.8 secs [2017/12/12 12:37:39 +0000] poller.php(24853): /opt/observium/poller.php: jayxxx - 1 devices polled in 157.5 secs [2017/12/12 12:42:36 +0000] poller.php(31743): /opt/observium/poller.php: jayxxx - 1 devices polled in 155.1 secs [2017/12/12 12:47:35 +0000] poller.php(918): /opt/observium/poller.php: jayxxx - 1 devices polled in 154.1 secs [2017/12/12 12:52:34 +0000] poller.php(2685): /opt/observium/poller.php: jayxxx - 1 devices polled in 152.7 secs [2017/12/12 12:57:33 +0000] poller.php(6267): /opt/observium/poller.php: jayxxx - 1 devices polled in 151.7 secs [2017/12/12 13:02:30 +0000] poller.php(11093): /opt/observium/poller.php: jayxxx - 1 devices polled in 148.2 secs [2017/12/12 13:07:37 +0000] poller.php(14342): /opt/observium/poller.php: jayxxx - 1 devices polled in 155.0 secs [2017/12/12 13:12:20 +0000] poller.php(17116): /opt/observium/poller.php: jayxxx - 1 devices polled in 138.3 secs [2017/12/12 13:17:12 +0000] poller.php(18797): /opt/observium/poller.php: jayxxx - 1 devices polled in 129.9 secs [2017/12/12 13:22:29 +0000] discovery.php(18423): /opt/observium/discovery.php: jayxxx - 1 devices discovered in 178.5 secs [2017/12/12 13:22:47 +0000] poller.php(25318): /opt/observium/poller.php: jayxxx - 1 devices polled in 166.0 secs [2017/12/12 13:27:35 +0000] poller.php(27070): /opt/observium/poller.php: jayxxx - 1 devices polled in 153.2 secs [2017/12/12 13:32:22 +0000] poller.php(28740): /opt/observium/poller.php: jayxxx - 1 devices polled in 140.1 secs [2017/12/12 13:37:19 +0000] poller.php(31747): /opt/observium/poller.php: jayxxx - 1 devices polled in 137.1 secs [2017/12/12 13:42:18 +0000] discovery.php(14545): /opt/observium/discovery.php: jayxxx - 1 devices discovered in 206.4 secs [2017/12/12 13:42:39 +0000] poller.php(2225): /opt/observium/poller.php: jayxxx - 1 devices polled in 157.0 secs [2017/12/12 13:47:31 +0000] poller.php(5992): /opt/observium/poller.php: jayxxx - 1 devices polled in 149.2 secs [2017/12/12 13:52:21 +0000] poller.php(8767): /opt/observium/poller.php: jayxxx - 1 devices polled in 139.3 secs [2017/12/12 13:55:21 +0000] poller.php(18678): /opt/observium/poller.php: jayxxx - 1 devices polled in 129.5 secs [2017/12/12 13:57:16 +0000] poller.php(10836): /opt/observium/poller.php: jayxxx - 1 devices polled in 134.1 secs [2017/12/12 14:02:34 +0000] poller.php(14434): /opt/observium/poller.php: jayxxx - 1 devices polled in 152.4 secs [2017/12/12 14:07:16 +0000] poller.php(16199): /opt/observium/poller.php: jayxxx - 1 devices polled in 134.4 secs [2017/12/12 14:12:22 +0000] poller.php(18143): /opt/observium/poller.php: jayxxx - 1 devices polled in 140.1 secs [2017/12/12 14:17:17 +0000] poller.php(19794): /opt/observium/poller.php: jayxxx - 1 devices polled in 134.8 secs [2017/12/12 14:22:20 +0000] poller.php(22296): /opt/observium/poller.php: jayxxx - 1 devices polled in 138.0 secs [2017/12/12 14:27:13 +0000] poller.php(25090): /opt/observium/poller.php: jayxxx - 1 devices polled in 131.4 secs [2017/12/12 14:31:22 +0000] poller.php(9089): /opt/observium/poller.php: jayxxx - 1 devices polled in 141.0 secs [2017/12/12 14:32:30 +0000] poller.php(26759): /opt/observium/poller.php: jayxxx - 1 devices polled in 148.5 secs infra [root@observ001prvitx logs]#
On Tue, Dec 12, 2017 at 4:26 PM, Markus Klock markus@best-practice.se wrote:
and no eventlog entry about snmpwalk timeout?
/Markus
2017-12-12 15:21 GMT+01:00 Edvinas K edvinas.email@gmail.com:
I did a manual poller-wrapper and sicovery on it - but still, i dont see a port (entity) in alert checker.
Alo attaching a Screenshot:
[image: Inline image 1]
On Tue, Dec 12, 2017 at 3:58 PM, Markus Klock markus@best-practice.se wrote:
Can you screenshot the Performance Data of that device? Cog-wheel at the top right on the device-page. Cisco Nexus have a pretty bad SNMP-stack. /Markus
2017-12-12 14:45 GMT+01:00 Edvinas K edvinas.email@gmail.com:
I did a manual discover (Discovery time - 206.3) but it still marked as deleted:
2017-12-12 14:42:05 Interface was marked as DELETED < after my discover. 2017-12-12 14:26:32 Interface DELETED mark removed 2017-12-12 14:22:16 Interface was marked as DELETED 2017-12-12 14:06:33 Interface DELETED mark removed 2017-12-12 14:01:56 Interface was marked as DELETED 2017-12-12 09:56:36 Interface changed: [ifAlias] '' -> 'vPC Keep-alive link'
What's wrong ?
On Tue, Dec 12, 2017 at 3:22 PM, Adam Armstrong adama@observium.org wrote:
Hi,
Alert (and group) associations are rebuilt directly after a device discovery, so if during a discovery some ports are removed or their ifType/ifAlias is returned black because of timed out snmp, they'll drop off this checker.
Do you see the ifType/Alias being changed in the entity's logs?
adam.
On 2017-12-12 13:09:15, Edvinas K edvinas.email@gmail.com wrote: Hello,
I've created alarm checker:
os equals nxos hostname match *NET*
ifType equals ethernetCsmacd ifAlias match *vPC Keep-alive link*
And after a while i noticed that some entities where disapeared. The device was reachable and etc. I did a "rebuild' and they're reappeared again. What could be the cause ? NXOS ? :) _______________________________________________ observium mailing list observium@observium.org http://postman.memetic.org/cgi -bin/mailman/listinfo/observium
observium mailing list observium@observium.org http://postman.memetic.org/cgi-bin/mailman/listinfo/observium
observium mailing list observium@observium.org http://postman.memetic.org/cgi-bin/mailman/listinfo/observium
observium mailing list observium@observium.org http://postman.memetic.org/cgi-bin/mailman/listinfo/observium
observium mailing list observium@observium.org http://postman.memetic.org/cgi-bin/mailman/listinfo/observium
observium mailing list observium@observium.org http://postman.memetic.org/cgi-bin/mailman/listinfo/observium
p.s after "alert regeneration" for sometime it's ok.
Somewhere i saw that after automatic disovery (discovery.php -h all) ? alerts should be regenerated ? is this still true?
Maybe there are some other command line to do only alarm regeneration - for example every 3 hours.
On Wed, Dec 13, 2017 at 10:02 AM, Edvinas K edvinas.email@gmail.com wrote:
so where coud be a problem ?
Poller.php polls in quite normal time:
[2017/12/13 07:37:30 +0000] poller.php(28605): /opt/observium/poller.php: jaynetxxx - 1 devices polled in 148.7 secs [2017/12/13 07:42:22 +0000] poller.php(30304): /opt/observium/poller.php: jaynetxxx - 1 devices polled in 140.3 secs [2017/12/13 07:47:28 +0000] poller.php(2525): /opt/observium/poller.php: jaynetxxx - 1 devices polled in 147.1 secs [2017/12/13 07:52:27 +0000] poller.php(6010): /opt/observium/poller.php: jaynetxxx - 1 devices polled in 145.6 secs
Disovery process (which is snmpwalk ?) completes the job in: 235.2 seconds
Device SNMP seetings: Max repetitions is set to: 20 .
For example the the port is marked as deleted:
but the traffic graphs are still shown:
[image: Inline image 1]
When device is discovering (discovery -h) im seeing that the particular port is on:
| Protocol | ifName | Remote: hostname | port | platform | version | +----------+------------------+----------------------------- ---------+-------------------------+----------------------+- -----------------------------------------+ | CDP | mgmt0 | JAYNET01A | mgmt0 | N5K-C5548UP | Cisco Nexus Operating System (NX-OS) ... |
So where could be the problem ?
On Tue, Dec 12, 2017 at 4:33 PM, Edvinas K edvinas.email@gmail.com wrote:
/opt/observium/poller-wrapper.py --host jayxxx /opt/observium/poller-wrapper.py:568: Warning: Data truncated for column 'process_name' at row 1 cursor.execute(p_query, (pid,ppid,processname,uid,command,s_time)) INFO: starting the poller at 2017/12/12 15:29:01 with 16 threads /usr/bin/env php /opt/observium/poller.php -q -h 223 >> /dev/null 2>&1 INFO: starting alerter.php for 223 INFO: finished alerter.php for 223 INFO: worker Thread-1 finished device 223 in 141 seconds INFO: poller-wrapper.py poller --host jayxxx processed 1 devices in 141.60 seconds with 16 threads, load average (5min) 1.95
Number of rows updated: 1
here the observium.log information:
infra [root@observ001prvitx logs]# cat observium.log | grep jayxxx | tail -30 [2017/12/12 12:27:38 +0000] poller.php(26069): /opt/observium/poller.php: jayxxx - 1 devices polled in 156.5 secs [2017/12/12 12:32:38 +0000] poller.php(27576): /opt/observium/poller.php: jayxxx - 1 devices polled in 155.8 secs [2017/12/12 12:37:39 +0000] poller.php(24853): /opt/observium/poller.php: jayxxx - 1 devices polled in 157.5 secs [2017/12/12 12:42:36 +0000] poller.php(31743): /opt/observium/poller.php: jayxxx - 1 devices polled in 155.1 secs [2017/12/12 12:47:35 +0000] poller.php(918): /opt/observium/poller.php: jayxxx - 1 devices polled in 154.1 secs [2017/12/12 12:52:34 +0000] poller.php(2685): /opt/observium/poller.php: jayxxx - 1 devices polled in 152.7 secs [2017/12/12 12:57:33 +0000] poller.php(6267): /opt/observium/poller.php: jayxxx - 1 devices polled in 151.7 secs [2017/12/12 13:02:30 +0000] poller.php(11093): /opt/observium/poller.php: jayxxx - 1 devices polled in 148.2 secs [2017/12/12 13:07:37 +0000] poller.php(14342): /opt/observium/poller.php: jayxxx - 1 devices polled in 155.0 secs [2017/12/12 13:12:20 +0000] poller.php(17116): /opt/observium/poller.php: jayxxx - 1 devices polled in 138.3 secs [2017/12/12 13:17:12 +0000] poller.php(18797): /opt/observium/poller.php: jayxxx - 1 devices polled in 129.9 secs [2017/12/12 13:22:29 +0000] discovery.php(18423): /opt/observium/discovery.php: jayxxx - 1 devices discovered in 178.5 secs [2017/12/12 13:22:47 +0000] poller.php(25318): /opt/observium/poller.php: jayxxx - 1 devices polled in 166.0 secs [2017/12/12 13:27:35 +0000] poller.php(27070): /opt/observium/poller.php: jayxxx - 1 devices polled in 153.2 secs [2017/12/12 13:32:22 +0000] poller.php(28740): /opt/observium/poller.php: jayxxx - 1 devices polled in 140.1 secs [2017/12/12 13:37:19 +0000] poller.php(31747): /opt/observium/poller.php: jayxxx - 1 devices polled in 137.1 secs [2017/12/12 13:42:18 +0000] discovery.php(14545): /opt/observium/discovery.php: jayxxx - 1 devices discovered in 206.4 secs [2017/12/12 13:42:39 +0000] poller.php(2225): /opt/observium/poller.php: jayxxx - 1 devices polled in 157.0 secs [2017/12/12 13:47:31 +0000] poller.php(5992): /opt/observium/poller.php: jayxxx - 1 devices polled in 149.2 secs [2017/12/12 13:52:21 +0000] poller.php(8767): /opt/observium/poller.php: jayxxx - 1 devices polled in 139.3 secs [2017/12/12 13:55:21 +0000] poller.php(18678): /opt/observium/poller.php: jayxxx - 1 devices polled in 129.5 secs [2017/12/12 13:57:16 +0000] poller.php(10836): /opt/observium/poller.php: jayxxx - 1 devices polled in 134.1 secs [2017/12/12 14:02:34 +0000] poller.php(14434): /opt/observium/poller.php: jayxxx - 1 devices polled in 152.4 secs [2017/12/12 14:07:16 +0000] poller.php(16199): /opt/observium/poller.php: jayxxx - 1 devices polled in 134.4 secs [2017/12/12 14:12:22 +0000] poller.php(18143): /opt/observium/poller.php: jayxxx - 1 devices polled in 140.1 secs [2017/12/12 14:17:17 +0000] poller.php(19794): /opt/observium/poller.php: jayxxx - 1 devices polled in 134.8 secs [2017/12/12 14:22:20 +0000] poller.php(22296): /opt/observium/poller.php: jayxxx - 1 devices polled in 138.0 secs [2017/12/12 14:27:13 +0000] poller.php(25090): /opt/observium/poller.php: jayxxx - 1 devices polled in 131.4 secs [2017/12/12 14:31:22 +0000] poller.php(9089): /opt/observium/poller.php: jayxxx - 1 devices polled in 141.0 secs [2017/12/12 14:32:30 +0000] poller.php(26759): /opt/observium/poller.php: jayxxx - 1 devices polled in 148.5 secs infra [root@observ001prvitx logs]#
On Tue, Dec 12, 2017 at 4:26 PM, Markus Klock markus@best-practice.se wrote:
and no eventlog entry about snmpwalk timeout?
/Markus
2017-12-12 15:21 GMT+01:00 Edvinas K edvinas.email@gmail.com:
I did a manual poller-wrapper and sicovery on it - but still, i dont see a port (entity) in alert checker.
Alo attaching a Screenshot:
[image: Inline image 1]
On Tue, Dec 12, 2017 at 3:58 PM, Markus Klock markus@best-practice.se wrote:
Can you screenshot the Performance Data of that device? Cog-wheel at the top right on the device-page. Cisco Nexus have a pretty bad SNMP-stack. /Markus
2017-12-12 14:45 GMT+01:00 Edvinas K edvinas.email@gmail.com:
I did a manual discover (Discovery time - 206.3) but it still marked as deleted:
2017-12-12 14:42:05 Interface was marked as DELETED < after my discover. 2017-12-12 14:26:32 Interface DELETED mark removed 2017-12-12 14:22:16 Interface was marked as DELETED 2017-12-12 14:06:33 Interface DELETED mark removed 2017-12-12 14:01:56 Interface was marked as DELETED 2017-12-12 09:56:36 Interface changed: [ifAlias] '' -> 'vPC Keep-alive link'
What's wrong ?
On Tue, Dec 12, 2017 at 3:22 PM, Adam Armstrong adama@observium.org wrote:
> Hi, > > Alert (and group) associations are rebuilt directly after a device > discovery, so if during a discovery some ports are removed or their > ifType/ifAlias is returned black because of timed out snmp, they'll drop > off this checker. > > Do you see the ifType/Alias being changed in the entity's logs? > > adam. > > On 2017-12-12 13:09:15, Edvinas K edvinas.email@gmail.com wrote: > Hello, > > I've created alarm checker: > > os equals nxos > hostname match *NET* > > ifType equals ethernetCsmacd > ifAlias match *vPC Keep-alive link* > > > And after a while i noticed that some entities where disapeared. The > device was reachable and etc. > I did a "rebuild' and they're reappeared again. What could be the > cause ? NXOS ? :) > _______________________________________________ observium mailing > list observium@observium.org http://postman.memetic.org/cgi > -bin/mailman/listinfo/observium > > > _______________________________________________ > observium mailing list > observium@observium.org > http://postman.memetic.org/cgi-bin/mailman/listinfo/observium > >
observium mailing list observium@observium.org http://postman.memetic.org/cgi-bin/mailman/listinfo/observium
observium mailing list observium@observium.org http://postman.memetic.org/cgi-bin/mailman/listinfo/observium
observium mailing list observium@observium.org http://postman.memetic.org/cgi-bin/mailman/listinfo/observium
observium mailing list observium@observium.org http://postman.memetic.org/cgi-bin/mailman/listinfo/observium
update:
after i DO:
/opt/observium/discovery.php -h jayXXX
##### Finished discovery run at 2017-12-15 09:57:03 #####
o Devices Discovered 1 o Discovery Time 249.8 secs o Memory usage 34MB (peak: 34MB) o MySQL Usage Cell[547/0.319s] Row[1739/1.934s] Rows[96/0.117s] Column[0/0s] Update[82/0.164s] Insert[2104/7.92s] Delete[6/0.023s]
i got this information which says that SNMP walk is OK.
And after that in port event log i see:
2017-12-15 10:55:30 Interface was marked as DELETED
why is that ?
On Wed, Dec 13, 2017 at 10:44 AM, Edvinas K edvinas.email@gmail.com wrote:
p.s after "alert regeneration" for sometime it's ok.
Somewhere i saw that after automatic disovery (discovery.php -h all) ? alerts should be regenerated ? is this still true?
Maybe there are some other command line to do only alarm regeneration - for example every 3 hours.
On Wed, Dec 13, 2017 at 10:02 AM, Edvinas K edvinas.email@gmail.com wrote:
so where coud be a problem ?
Poller.php polls in quite normal time:
[2017/12/13 07:37:30 +0000] poller.php(28605): /opt/observium/poller.php: jaynetxxx - 1 devices polled in 148.7 secs [2017/12/13 07:42:22 +0000] poller.php(30304): /opt/observium/poller.php: jaynetxxx - 1 devices polled in 140.3 secs [2017/12/13 07:47:28 +0000] poller.php(2525): /opt/observium/poller.php: jaynetxxx - 1 devices polled in 147.1 secs [2017/12/13 07:52:27 +0000] poller.php(6010): /opt/observium/poller.php: jaynetxxx - 1 devices polled in 145.6 secs
Disovery process (which is snmpwalk ?) completes the job in: 235.2 seconds
Device SNMP seetings: Max repetitions is set to: 20 .
For example the the port is marked as deleted:
but the traffic graphs are still shown:
[image: Inline image 1]
When device is discovering (discovery -h) im seeing that the particular port is on:
| Protocol | ifName | Remote: hostname | port | platform | version | +----------+------------------+----------------------------- ---------+-------------------------+----------------------+- -----------------------------------------+ | CDP | mgmt0 | JAYNET01A | mgmt0 | N5K-C5548UP | Cisco Nexus Operating System (NX-OS) ... |
So where could be the problem ?
On Tue, Dec 12, 2017 at 4:33 PM, Edvinas K edvinas.email@gmail.com wrote:
/opt/observium/poller-wrapper.py --host jayxxx /opt/observium/poller-wrapper.py:568: Warning: Data truncated for column 'process_name' at row 1 cursor.execute(p_query, (pid,ppid,processname,uid,command,s_time)) INFO: starting the poller at 2017/12/12 15:29:01 with 16 threads /usr/bin/env php /opt/observium/poller.php -q -h 223 >> /dev/null 2>&1 INFO: starting alerter.php for 223 INFO: finished alerter.php for 223 INFO: worker Thread-1 finished device 223 in 141 seconds INFO: poller-wrapper.py poller --host jayxxx processed 1 devices in 141.60 seconds with 16 threads, load average (5min) 1.95
Number of rows updated: 1
here the observium.log information:
infra [root@observ001prvitx logs]# cat observium.log | grep jayxxx | tail -30 [2017/12/12 12:27:38 +0000] poller.php(26069): /opt/observium/poller.php: jayxxx - 1 devices polled in 156.5 secs [2017/12/12 12:32:38 +0000] poller.php(27576): /opt/observium/poller.php: jayxxx - 1 devices polled in 155.8 secs [2017/12/12 12:37:39 +0000] poller.php(24853): /opt/observium/poller.php: jayxxx - 1 devices polled in 157.5 secs [2017/12/12 12:42:36 +0000] poller.php(31743): /opt/observium/poller.php: jayxxx - 1 devices polled in 155.1 secs [2017/12/12 12:47:35 +0000] poller.php(918): /opt/observium/poller.php: jayxxx - 1 devices polled in 154.1 secs [2017/12/12 12:52:34 +0000] poller.php(2685): /opt/observium/poller.php: jayxxx - 1 devices polled in 152.7 secs [2017/12/12 12:57:33 +0000] poller.php(6267): /opt/observium/poller.php: jayxxx - 1 devices polled in 151.7 secs [2017/12/12 13:02:30 +0000] poller.php(11093): /opt/observium/poller.php: jayxxx - 1 devices polled in 148.2 secs [2017/12/12 13:07:37 +0000] poller.php(14342): /opt/observium/poller.php: jayxxx - 1 devices polled in 155.0 secs [2017/12/12 13:12:20 +0000] poller.php(17116): /opt/observium/poller.php: jayxxx - 1 devices polled in 138.3 secs [2017/12/12 13:17:12 +0000] poller.php(18797): /opt/observium/poller.php: jayxxx - 1 devices polled in 129.9 secs [2017/12/12 13:22:29 +0000] discovery.php(18423): /opt/observium/discovery.php: jayxxx - 1 devices discovered in 178.5 secs [2017/12/12 13:22:47 +0000] poller.php(25318): /opt/observium/poller.php: jayxxx - 1 devices polled in 166.0 secs [2017/12/12 13:27:35 +0000] poller.php(27070): /opt/observium/poller.php: jayxxx - 1 devices polled in 153.2 secs [2017/12/12 13:32:22 +0000] poller.php(28740): /opt/observium/poller.php: jayxxx - 1 devices polled in 140.1 secs [2017/12/12 13:37:19 +0000] poller.php(31747): /opt/observium/poller.php: jayxxx - 1 devices polled in 137.1 secs [2017/12/12 13:42:18 +0000] discovery.php(14545): /opt/observium/discovery.php: jayxxx - 1 devices discovered in 206.4 secs [2017/12/12 13:42:39 +0000] poller.php(2225): /opt/observium/poller.php: jayxxx - 1 devices polled in 157.0 secs [2017/12/12 13:47:31 +0000] poller.php(5992): /opt/observium/poller.php: jayxxx - 1 devices polled in 149.2 secs [2017/12/12 13:52:21 +0000] poller.php(8767): /opt/observium/poller.php: jayxxx - 1 devices polled in 139.3 secs [2017/12/12 13:55:21 +0000] poller.php(18678): /opt/observium/poller.php: jayxxx - 1 devices polled in 129.5 secs [2017/12/12 13:57:16 +0000] poller.php(10836): /opt/observium/poller.php: jayxxx - 1 devices polled in 134.1 secs [2017/12/12 14:02:34 +0000] poller.php(14434): /opt/observium/poller.php: jayxxx - 1 devices polled in 152.4 secs [2017/12/12 14:07:16 +0000] poller.php(16199): /opt/observium/poller.php: jayxxx - 1 devices polled in 134.4 secs [2017/12/12 14:12:22 +0000] poller.php(18143): /opt/observium/poller.php: jayxxx - 1 devices polled in 140.1 secs [2017/12/12 14:17:17 +0000] poller.php(19794): /opt/observium/poller.php: jayxxx - 1 devices polled in 134.8 secs [2017/12/12 14:22:20 +0000] poller.php(22296): /opt/observium/poller.php: jayxxx - 1 devices polled in 138.0 secs [2017/12/12 14:27:13 +0000] poller.php(25090): /opt/observium/poller.php: jayxxx - 1 devices polled in 131.4 secs [2017/12/12 14:31:22 +0000] poller.php(9089): /opt/observium/poller.php: jayxxx - 1 devices polled in 141.0 secs [2017/12/12 14:32:30 +0000] poller.php(26759): /opt/observium/poller.php: jayxxx - 1 devices polled in 148.5 secs infra [root@observ001prvitx logs]#
On Tue, Dec 12, 2017 at 4:26 PM, Markus Klock markus@best-practice.se wrote:
and no eventlog entry about snmpwalk timeout?
/Markus
2017-12-12 15:21 GMT+01:00 Edvinas K edvinas.email@gmail.com:
I did a manual poller-wrapper and sicovery on it - but still, i dont see a port (entity) in alert checker.
Alo attaching a Screenshot:
[image: Inline image 1]
On Tue, Dec 12, 2017 at 3:58 PM, Markus Klock <markus@best-practice.se
wrote:
Can you screenshot the Performance Data of that device? Cog-wheel at the top right on the device-page. Cisco Nexus have a pretty bad SNMP-stack. /Markus
2017-12-12 14:45 GMT+01:00 Edvinas K edvinas.email@gmail.com:
> I did a manual discover (Discovery time - 206.3) but it still marked > as deleted: > > 2017-12-12 14:42:05 Interface was marked as DELETED < after my > discover. > 2017-12-12 14:26:32 Interface DELETED mark removed > 2017-12-12 14:22:16 Interface was marked as DELETED > 2017-12-12 14:06:33 Interface DELETED mark removed > 2017-12-12 14:01:56 Interface was marked as DELETED > 2017-12-12 09:56:36 Interface changed: [ifAlias] '' -> 'vPC > Keep-alive link' > > What's wrong ? > > > > On Tue, Dec 12, 2017 at 3:22 PM, Adam Armstrong <adama@observium.org > > wrote: > >> Hi, >> >> Alert (and group) associations are rebuilt directly after a device >> discovery, so if during a discovery some ports are removed or their >> ifType/ifAlias is returned black because of timed out snmp, they'll drop >> off this checker. >> >> Do you see the ifType/Alias being changed in the entity's logs? >> >> adam. >> >> On 2017-12-12 13:09:15, Edvinas K edvinas.email@gmail.com wrote: >> Hello, >> >> I've created alarm checker: >> >> os equals nxos >> hostname match *NET* >> >> ifType equals ethernetCsmacd >> ifAlias match *vPC Keep-alive link* >> >> >> And after a while i noticed that some entities where disapeared. >> The device was reachable and etc. >> I did a "rebuild' and they're reappeared again. What could be the >> cause ? NXOS ? :) >> _______________________________________________ observium mailing >> list observium@observium.org http://postman.memetic.org/cgi >> -bin/mailman/listinfo/observium >> >> >> _______________________________________________ >> observium mailing list >> observium@observium.org >> http://postman.memetic.org/cgi-bin/mailman/listinfo/observium >> >> > > _______________________________________________ > observium mailing list > observium@observium.org > http://postman.memetic.org/cgi-bin/mailman/listinfo/observium > >
observium mailing list observium@observium.org http://postman.memetic.org/cgi-bin/mailman/listinfo/observium
observium mailing list observium@observium.org http://postman.memetic.org/cgi-bin/mailman/listinfo/observium
observium mailing list observium@observium.org http://postman.memetic.org/cgi-bin/mailman/listinfo/observium
since only after the manual "alert regenrate" the missing ports starts to appear, i want to ask you.
Do you see any risks in putting the /opt/observium/html/pages/alert_regenerate.inc.php script in a cron tab and run in for example every ~3 hours ?
Thanks
On Fri, Dec 15, 2017 at 12:00 PM, Edvinas K edvinas.email@gmail.com wrote:
update:
after i DO:
/opt/observium/discovery.php -h jayXXX
##### Finished discovery run at 2017-12-15 09:57:03 #####
o Devices Discovered 1 o Discovery Time 249.8 secs o Memory usage 34MB (peak: 34MB) o MySQL Usage Cell[547/0.319s] Row[1739/1.934s] Rows[96/0.117s] Column[0/0s] Update[82/0.164s] Insert[2104/7.92s] Delete[6/0.023s]
i got this information which says that SNMP walk is OK.
And after that in port event log i see:
2017-12-15 10:55:30 Interface was marked as DELETED
why is that ?
On Wed, Dec 13, 2017 at 10:44 AM, Edvinas K edvinas.email@gmail.com wrote:
p.s after "alert regeneration" for sometime it's ok.
Somewhere i saw that after automatic disovery (discovery.php -h all) ? alerts should be regenerated ? is this still true?
Maybe there are some other command line to do only alarm regeneration - for example every 3 hours.
On Wed, Dec 13, 2017 at 10:02 AM, Edvinas K edvinas.email@gmail.com wrote:
so where coud be a problem ?
Poller.php polls in quite normal time:
[2017/12/13 07:37:30 +0000] poller.php(28605): /opt/observium/poller.php: jaynetxxx - 1 devices polled in 148.7 secs [2017/12/13 07:42:22 +0000] poller.php(30304): /opt/observium/poller.php: jaynetxxx - 1 devices polled in 140.3 secs [2017/12/13 07:47:28 +0000] poller.php(2525): /opt/observium/poller.php: jaynetxxx - 1 devices polled in 147.1 secs [2017/12/13 07:52:27 +0000] poller.php(6010): /opt/observium/poller.php: jaynetxxx - 1 devices polled in 145.6 secs
Disovery process (which is snmpwalk ?) completes the job in: 235.2 seconds
Device SNMP seetings: Max repetitions is set to: 20 .
For example the the port is marked as deleted:
but the traffic graphs are still shown:
[image: Inline image 1]
When device is discovering (discovery -h) im seeing that the particular port is on:
| Protocol | ifName | Remote: hostname | port | platform | version | +----------+------------------+----------------------------- ---------+-------------------------+----------------------+- -----------------------------------------+ | CDP | mgmt0 | JAYNET01A | mgmt0 | N5K-C5548UP | Cisco Nexus Operating System (NX-OS) ... |
So where could be the problem ?
On Tue, Dec 12, 2017 at 4:33 PM, Edvinas K edvinas.email@gmail.com wrote:
/opt/observium/poller-wrapper.py --host jayxxx /opt/observium/poller-wrapper.py:568: Warning: Data truncated for column 'process_name' at row 1 cursor.execute(p_query, (pid,ppid,processname,uid,command,s_time)) INFO: starting the poller at 2017/12/12 15:29:01 with 16 threads /usr/bin/env php /opt/observium/poller.php -q -h 223 >> /dev/null 2>&1 INFO: starting alerter.php for 223 INFO: finished alerter.php for 223 INFO: worker Thread-1 finished device 223 in 141 seconds INFO: poller-wrapper.py poller --host jayxxx processed 1 devices in 141.60 seconds with 16 threads, load average (5min) 1.95
Number of rows updated: 1
here the observium.log information:
infra [root@observ001prvitx logs]# cat observium.log | grep jayxxx | tail -30 [2017/12/12 12:27:38 +0000] poller.php(26069): /opt/observium/poller.php: jayxxx - 1 devices polled in 156.5 secs [2017/12/12 12:32:38 +0000] poller.php(27576): /opt/observium/poller.php: jayxxx - 1 devices polled in 155.8 secs [2017/12/12 12:37:39 +0000] poller.php(24853): /opt/observium/poller.php: jayxxx - 1 devices polled in 157.5 secs [2017/12/12 12:42:36 +0000] poller.php(31743): /opt/observium/poller.php: jayxxx - 1 devices polled in 155.1 secs [2017/12/12 12:47:35 +0000] poller.php(918): /opt/observium/poller.php: jayxxx - 1 devices polled in 154.1 secs [2017/12/12 12:52:34 +0000] poller.php(2685): /opt/observium/poller.php: jayxxx - 1 devices polled in 152.7 secs [2017/12/12 12:57:33 +0000] poller.php(6267): /opt/observium/poller.php: jayxxx - 1 devices polled in 151.7 secs [2017/12/12 13:02:30 +0000] poller.php(11093): /opt/observium/poller.php: jayxxx - 1 devices polled in 148.2 secs [2017/12/12 13:07:37 +0000] poller.php(14342): /opt/observium/poller.php: jayxxx - 1 devices polled in 155.0 secs [2017/12/12 13:12:20 +0000] poller.php(17116): /opt/observium/poller.php: jayxxx - 1 devices polled in 138.3 secs [2017/12/12 13:17:12 +0000] poller.php(18797): /opt/observium/poller.php: jayxxx - 1 devices polled in 129.9 secs [2017/12/12 13:22:29 +0000] discovery.php(18423): /opt/observium/discovery.php: jayxxx - 1 devices discovered in 178.5 secs [2017/12/12 13:22:47 +0000] poller.php(25318): /opt/observium/poller.php: jayxxx - 1 devices polled in 166.0 secs [2017/12/12 13:27:35 +0000] poller.php(27070): /opt/observium/poller.php: jayxxx - 1 devices polled in 153.2 secs [2017/12/12 13:32:22 +0000] poller.php(28740): /opt/observium/poller.php: jayxxx - 1 devices polled in 140.1 secs [2017/12/12 13:37:19 +0000] poller.php(31747): /opt/observium/poller.php: jayxxx - 1 devices polled in 137.1 secs [2017/12/12 13:42:18 +0000] discovery.php(14545): /opt/observium/discovery.php: jayxxx - 1 devices discovered in 206.4 secs [2017/12/12 13:42:39 +0000] poller.php(2225): /opt/observium/poller.php: jayxxx - 1 devices polled in 157.0 secs [2017/12/12 13:47:31 +0000] poller.php(5992): /opt/observium/poller.php: jayxxx - 1 devices polled in 149.2 secs [2017/12/12 13:52:21 +0000] poller.php(8767): /opt/observium/poller.php: jayxxx - 1 devices polled in 139.3 secs [2017/12/12 13:55:21 +0000] poller.php(18678): /opt/observium/poller.php: jayxxx - 1 devices polled in 129.5 secs [2017/12/12 13:57:16 +0000] poller.php(10836): /opt/observium/poller.php: jayxxx - 1 devices polled in 134.1 secs [2017/12/12 14:02:34 +0000] poller.php(14434): /opt/observium/poller.php: jayxxx - 1 devices polled in 152.4 secs [2017/12/12 14:07:16 +0000] poller.php(16199): /opt/observium/poller.php: jayxxx - 1 devices polled in 134.4 secs [2017/12/12 14:12:22 +0000] poller.php(18143): /opt/observium/poller.php: jayxxx - 1 devices polled in 140.1 secs [2017/12/12 14:17:17 +0000] poller.php(19794): /opt/observium/poller.php: jayxxx - 1 devices polled in 134.8 secs [2017/12/12 14:22:20 +0000] poller.php(22296): /opt/observium/poller.php: jayxxx - 1 devices polled in 138.0 secs [2017/12/12 14:27:13 +0000] poller.php(25090): /opt/observium/poller.php: jayxxx - 1 devices polled in 131.4 secs [2017/12/12 14:31:22 +0000] poller.php(9089): /opt/observium/poller.php: jayxxx - 1 devices polled in 141.0 secs [2017/12/12 14:32:30 +0000] poller.php(26759): /opt/observium/poller.php: jayxxx - 1 devices polled in 148.5 secs infra [root@observ001prvitx logs]#
On Tue, Dec 12, 2017 at 4:26 PM, Markus Klock markus@best-practice.se wrote:
and no eventlog entry about snmpwalk timeout?
/Markus
2017-12-12 15:21 GMT+01:00 Edvinas K edvinas.email@gmail.com:
I did a manual poller-wrapper and sicovery on it - but still, i dont see a port (entity) in alert checker.
Alo attaching a Screenshot:
[image: Inline image 1]
On Tue, Dec 12, 2017 at 3:58 PM, Markus Klock < markus@best-practice.se> wrote:
> Can you screenshot the Performance Data of that device? Cog-wheel at > the top right on the device-page. > Cisco Nexus have a pretty bad SNMP-stack. > /Markus > > 2017-12-12 14:45 GMT+01:00 Edvinas K edvinas.email@gmail.com: > >> I did a manual discover (Discovery time - 206.3) but it still >> marked as deleted: >> >> 2017-12-12 14:42:05 Interface was marked as DELETED < after my >> discover. >> 2017-12-12 14:26:32 Interface DELETED mark removed >> 2017-12-12 14:22:16 Interface was marked as DELETED >> 2017-12-12 14:06:33 Interface DELETED mark removed >> 2017-12-12 14:01:56 Interface was marked as DELETED >> 2017-12-12 09:56:36 Interface changed: [ifAlias] '' -> 'vPC >> Keep-alive link' >> >> What's wrong ? >> >> >> >> On Tue, Dec 12, 2017 at 3:22 PM, Adam Armstrong < >> adama@observium.org> wrote: >> >>> Hi, >>> >>> Alert (and group) associations are rebuilt directly after a device >>> discovery, so if during a discovery some ports are removed or their >>> ifType/ifAlias is returned black because of timed out snmp, they'll drop >>> off this checker. >>> >>> Do you see the ifType/Alias being changed in the entity's logs? >>> >>> adam. >>> >>> On 2017-12-12 13:09:15, Edvinas K edvinas.email@gmail.com wrote: >>> Hello, >>> >>> I've created alarm checker: >>> >>> os equals nxos >>> hostname match *NET* >>> >>> ifType equals ethernetCsmacd >>> ifAlias match *vPC Keep-alive link* >>> >>> >>> And after a while i noticed that some entities where disapeared. >>> The device was reachable and etc. >>> I did a "rebuild' and they're reappeared again. What could be the >>> cause ? NXOS ? :) >>> _______________________________________________ observium mailing >>> list observium@observium.org http://postman.memetic.org/cgi >>> -bin/mailman/listinfo/observium >>> >>> >>> _______________________________________________ >>> observium mailing list >>> observium@observium.org >>> http://postman.memetic.org/cgi-bin/mailman/listinfo/observium >>> >>> >> >> _______________________________________________ >> observium mailing list >> observium@observium.org >> http://postman.memetic.org/cgi-bin/mailman/listinfo/observium >> >> > > _______________________________________________ > observium mailing list > observium@observium.org > http://postman.memetic.org/cgi-bin/mailman/listinfo/observium > >
observium mailing list observium@observium.org http://postman.memetic.org/cgi-bin/mailman/listinfo/observium
observium mailing list observium@observium.org http://postman.memetic.org/cgi-bin/mailman/listinfo/observium

You could run it half an hour after discovery ends or something.
No risk really, it just might be database intensive.
Adam.
Sent from BlueMail
On 18 Dec 2017, 14:54, at 14:54, Edvinas K edvinas.email@gmail.com wrote:
since only after the manual "alert regenrate" the missing ports starts to appear, i want to ask you.
Do you see any risks in putting the /opt/observium/html/pages/alert_regenerate.inc.php script in a cron tab and run in for example every ~3 hours ?
Thanks
On Fri, Dec 15, 2017 at 12:00 PM, Edvinas K edvinas.email@gmail.com wrote:
update:
after i DO:
/opt/observium/discovery.php -h jayXXX
##### Finished discovery run at 2017-12-15 09:57:03 #####
o Devices Discovered 1 o Discovery Time 249.8 secs o Memory usage 34MB (peak: 34MB) o MySQL Usage Cell[547/0.319s] Row[1739/1.934s]
Rows[96/0.117s]
Column[0/0s] Update[82/0.164s] Insert[2104/7.92s] Delete[6/0.023s]
i got this information which says that SNMP walk is OK.
And after that in port event log i see:
2017-12-15 10:55:30 Interface was marked as DELETED
why is that ?
On Wed, Dec 13, 2017 at 10:44 AM, Edvinas K edvinas.email@gmail.com wrote:
p.s after "alert regeneration" for sometime it's ok.
Somewhere i saw that after automatic disovery (discovery.php -h all)
?
alerts should be regenerated ? is this still true?
Maybe there are some other command line to do only alarm
regeneration -
for example every 3 hours.
On Wed, Dec 13, 2017 at 10:02 AM, Edvinas K
wrote:
so where coud be a problem ?
Poller.php polls in quite normal time:
[2017/12/13 07:37:30 +0000] poller.php(28605): /opt/observium/poller.php: jaynetxxx - 1 devices polled in 148.7
secs
[2017/12/13 07:42:22 +0000] poller.php(30304): /opt/observium/poller.php: jaynetxxx - 1 devices polled in 140.3
secs
[2017/12/13 07:47:28 +0000] poller.php(2525):
/opt/observium/poller.php:
jaynetxxx - 1 devices polled in 147.1 secs [2017/12/13 07:52:27 +0000] poller.php(6010):
/opt/observium/poller.php:
jaynetxxx - 1 devices polled in 145.6 secs
Disovery process (which is snmpwalk ?) completes the job in: 235.2 seconds
Device SNMP seetings: Max repetitions is set to: 20 .
For example the the port is marked as deleted:
but the traffic graphs are still shown:
[image: Inline image 1]
When device is discovering (discovery -h) im seeing that the
particular
port is on:
| Protocol | ifName | Remote: hostname
|
port | platform | version | +----------+------------------+----------------------------- ---------+-------------------------+----------------------+- -----------------------------------------+ | CDP | mgmt0 | JAYNET01A
|
mgmt0 | N5K-C5548UP | Cisco Nexus
Operating
System (NX-OS) ... |
So where could be the problem ?
On Tue, Dec 12, 2017 at 4:33 PM, Edvinas K
wrote:
/opt/observium/poller-wrapper.py --host jayxxx /opt/observium/poller-wrapper.py:568: Warning: Data truncated for column 'process_name' at row 1 cursor.execute(p_query,
(pid,ppid,processname,uid,command,s_time))
INFO: starting the poller at 2017/12/12 15:29:01 with 16 threads /usr/bin/env php /opt/observium/poller.php -q -h 223 >> /dev/null
2>&1
INFO: starting alerter.php for 223 INFO: finished alerter.php for 223 INFO: worker Thread-1 finished device 223 in 141 seconds INFO: poller-wrapper.py poller --host jayxxx processed 1 devices
in
141.60 seconds with 16 threads, load average (5min) 1.95
Number of rows updated: 1
here the observium.log information:
infra [root@observ001prvitx logs]# cat observium.log | grep jayxxx
|
tail -30 [2017/12/12 12:27:38 +0000] poller.php(26069): /opt/observium/poller.php: jayxxx - 1 devices polled in 156.5 secs [2017/12/12 12:32:38 +0000] poller.php(27576): /opt/observium/poller.php: jayxxx - 1 devices polled in 155.8 secs [2017/12/12 12:37:39 +0000] poller.php(24853): /opt/observium/poller.php: jayxxx - 1 devices polled in 157.5 secs [2017/12/12 12:42:36 +0000] poller.php(31743): /opt/observium/poller.php: jayxxx - 1 devices polled in 155.1 secs [2017/12/12 12:47:35 +0000] poller.php(918):
/opt/observium/poller.php:
jayxxx - 1 devices polled in 154.1 secs [2017/12/12 12:52:34 +0000] poller.php(2685): /opt/observium/poller.php: jayxxx - 1 devices polled in 152.7 secs [2017/12/12 12:57:33 +0000] poller.php(6267): /opt/observium/poller.php: jayxxx - 1 devices polled in 151.7 secs [2017/12/12 13:02:30 +0000] poller.php(11093): /opt/observium/poller.php: jayxxx - 1 devices polled in 148.2 secs [2017/12/12 13:07:37 +0000] poller.php(14342): /opt/observium/poller.php: jayxxx - 1 devices polled in 155.0 secs [2017/12/12 13:12:20 +0000] poller.php(17116): /opt/observium/poller.php: jayxxx - 1 devices polled in 138.3 secs [2017/12/12 13:17:12 +0000] poller.php(18797): /opt/observium/poller.php: jayxxx - 1 devices polled in 129.9 secs [2017/12/12 13:22:29 +0000] discovery.php(18423): /opt/observium/discovery.php: jayxxx - 1 devices discovered in
178.5 secs
[2017/12/12 13:22:47 +0000] poller.php(25318): /opt/observium/poller.php: jayxxx - 1 devices polled in 166.0 secs [2017/12/12 13:27:35 +0000] poller.php(27070): /opt/observium/poller.php: jayxxx - 1 devices polled in 153.2 secs [2017/12/12 13:32:22 +0000] poller.php(28740): /opt/observium/poller.php: jayxxx - 1 devices polled in 140.1 secs [2017/12/12 13:37:19 +0000] poller.php(31747): /opt/observium/poller.php: jayxxx - 1 devices polled in 137.1 secs [2017/12/12 13:42:18 +0000] discovery.php(14545): /opt/observium/discovery.php: jayxxx - 1 devices discovered in
206.4 secs
[2017/12/12 13:42:39 +0000] poller.php(2225): /opt/observium/poller.php: jayxxx - 1 devices polled in 157.0 secs [2017/12/12 13:47:31 +0000] poller.php(5992): /opt/observium/poller.php: jayxxx - 1 devices polled in 149.2 secs [2017/12/12 13:52:21 +0000] poller.php(8767): /opt/observium/poller.php: jayxxx - 1 devices polled in 139.3 secs [2017/12/12 13:55:21 +0000] poller.php(18678): /opt/observium/poller.php: jayxxx - 1 devices polled in 129.5 secs [2017/12/12 13:57:16 +0000] poller.php(10836): /opt/observium/poller.php: jayxxx - 1 devices polled in 134.1 secs [2017/12/12 14:02:34 +0000] poller.php(14434): /opt/observium/poller.php: jayxxx - 1 devices polled in 152.4 secs [2017/12/12 14:07:16 +0000] poller.php(16199): /opt/observium/poller.php: jayxxx - 1 devices polled in 134.4 secs [2017/12/12 14:12:22 +0000] poller.php(18143): /opt/observium/poller.php: jayxxx - 1 devices polled in 140.1 secs [2017/12/12 14:17:17 +0000] poller.php(19794): /opt/observium/poller.php: jayxxx - 1 devices polled in 134.8 secs [2017/12/12 14:22:20 +0000] poller.php(22296): /opt/observium/poller.php: jayxxx - 1 devices polled in 138.0 secs [2017/12/12 14:27:13 +0000] poller.php(25090): /opt/observium/poller.php: jayxxx - 1 devices polled in 131.4 secs [2017/12/12 14:31:22 +0000] poller.php(9089): /opt/observium/poller.php: jayxxx - 1 devices polled in 141.0 secs [2017/12/12 14:32:30 +0000] poller.php(26759): /opt/observium/poller.php: jayxxx - 1 devices polled in 148.5 secs infra [root@observ001prvitx logs]#
On Tue, Dec 12, 2017 at 4:26 PM, Markus Klock
wrote:
and no eventlog entry about snmpwalk timeout?
/Markus
2017-12-12 15:21 GMT+01:00 Edvinas K edvinas.email@gmail.com:
> I did a manual poller-wrapper and sicovery on it - but still, i
dont
> see a port (entity) in alert checker. > > Alo attaching a Screenshot: > > > > [image: Inline image 1] > > On Tue, Dec 12, 2017 at 3:58 PM, Markus Klock < > markus@best-practice.se> wrote: > >> Can you screenshot the Performance Data of that device?
Cog-wheel at
>> the top right on the device-page. >> Cisco Nexus have a pretty bad SNMP-stack. >> /Markus >> >> 2017-12-12 14:45 GMT+01:00 Edvinas K edvinas.email@gmail.com: >> >>> I did a manual discover (Discovery time - 206.3) but it still >>> marked as deleted: >>> >>> 2017-12-12 14:42:05 Interface was marked as DELETED < after my >>> discover. >>> 2017-12-12 14:26:32 Interface DELETED mark removed >>> 2017-12-12 14:22:16 Interface was marked as DELETED >>> 2017-12-12 14:06:33 Interface DELETED mark removed >>> 2017-12-12 14:01:56 Interface was marked as DELETED >>> 2017-12-12 09:56:36 Interface changed: [ifAlias] '' -> 'vPC >>> Keep-alive link' >>> >>> What's wrong ? >>> >>> >>> >>> On Tue, Dec 12, 2017 at 3:22 PM, Adam Armstrong < >>> adama@observium.org> wrote: >>> >>>> Hi, >>>> >>>> Alert (and group) associations are rebuilt directly after a
device
>>>> discovery, so if during a discovery some ports are removed or
their
>>>> ifType/ifAlias is returned black because of timed out snmp,
they'll drop
>>>> off this checker. >>>> >>>> Do you see the ifType/Alias being changed in the entity's
logs?
>>>> >>>> adam. >>>> >>>> On 2017-12-12 13:09:15, Edvinas K edvinas.email@gmail.com
wrote:
>>>> Hello, >>>> >>>> I've created alarm checker: >>>> >>>> os equals nxos >>>> hostname match *NET* >>>> >>>> ifType equals ethernetCsmacd >>>> ifAlias match *vPC Keep-alive link* >>>> >>>> >>>> And after a while i noticed that some entities where
disapeared.
>>>> The device was reachable and etc. >>>> I did a "rebuild' and they're reappeared again. What could be
the
>>>> cause ? NXOS ? :) >>>> _______________________________________________ observium
mailing
>>>> list observium@observium.org http://postman.memetic.org/cgi >>>> -bin/mailman/listinfo/observium >>>> >>>> >>>> _______________________________________________ >>>> observium mailing list >>>> observium@observium.org >>>> http://postman.memetic.org/cgi-bin/mailman/listinfo/observium >>>> >>>> >>> >>> _______________________________________________ >>> observium mailing list >>> observium@observium.org >>> http://postman.memetic.org/cgi-bin/mailman/listinfo/observium >>> >>> >> >> _______________________________________________ >> observium mailing list >> observium@observium.org >> http://postman.memetic.org/cgi-bin/mailman/listinfo/observium >> >> > > _______________________________________________ > observium mailing list > observium@observium.org > http://postman.memetic.org/cgi-bin/mailman/listinfo/observium > >
observium mailing list observium@observium.org http://postman.memetic.org/cgi-bin/mailman/listinfo/observium
observium mailing list observium@observium.org http://postman.memetic.org/cgi-bin/mailman/listinfo/observium
1) could you advice which files to put in the cron - to make auto regenerate works ? Seems like that .php alone doesnt work
#auto regenrate 0 */7 * * * root /opt/observium/html/pages/alert_regenerate.inc.php
2) i remember when someone said that after /opt/observium/discovery.php -h all, there should be autoregeneration to - how to check if that really works ?
thank you
On Mon, Dec 18, 2017 at 6:06 PM, Adam Armstrong adama@memetic.org wrote:
You could run it half an hour after discovery ends or something.
No risk really, it just might be database intensive.
Adam.
Sent from BlueMail http://www.bluemail.me/r?b=11327 On 18 Dec 2017, at 14:54, Edvinas K <edvinas.email <%3Ca>@gmail.com target=_blank>edvinas.email@gmail.com> wrote:
since only after the manual "alert regenrate" the missing ports starts to appear, i want to ask you.
Do you see any risks in putting the /opt/observium/html/pages/alert_regenerate.inc.php script in a cron tab and run in for example every ~3 hours ?
Thanks
On Fri, Dec 15, 2017 at 12:00 PM, Edvinas K edvinas.email@gmail.com wrote:
update:
after i DO:
/opt/observium/discovery.php -h jayXXX
##### Finished discovery run at 2017-12-15 09:57:03 #####
o Devices Discovered 1 o Discovery Time 249.8 secs o Memory usage 34MB (peak: 34MB) o MySQL Usage Cell[547/0.319s] Row[1739/1.934s] Rows[96/0.117s] Column[0/0s] Update[82/0.164s] Insert[2104/7.92s] Delete[6/0.023s]
i got this information which says that SNMP walk is OK.
And after that in port event log i see:
2017-12-15 10:55:30 Interface was marked as DELETED
why is that ?
On Wed, Dec 13, 2017 at 10:44 AM, Edvinas K edvinas.email@gmail.com wrote:
p.s after "alert regeneration" for sometime it's ok.
Somewhere i saw that after automatic disovery (discovery.php -h all) ? alerts should be regenerated ? is this still true?
Maybe there are some other command line to do only alarm regeneration - for example every 3 hours.
On Wed, Dec 13, 2017 at 10:02 AM, Edvinas K edvinas.email@gmail.com wrote:
so where coud be a problem ?
Poller.php polls in quite normal time:
[2017/12/13 07:37:30 +0000] poller.php(28605): /opt/observium/poller.php: jaynetxxx - 1 devices polled in 148.7 secs [2017/12/13 07:42:22 +0000] poller.php(30304): /opt/observium/poller.php: jaynetxxx - 1 devices polled in 140.3 secs [2017/12/13 07:47:28 +0000] poller.php(2525): /opt/observium/poller.php: jaynetxxx - 1 devices polled in 147.1 secs [2017/12/13 07:52:27 +0000] poller.php(6010): /opt/observium/poller.php: jaynetxxx - 1 devices polled in 145.6 secs
Disovery process (which is snmpwalk ?) completes the job in: 235.2 seconds
Device SNMP seetings: Max repetitions is set to: 20 .
For example the the port is marked as deleted:
but the traffic graphs are still shown:
[image: Inline image 1]
When device is discovering (discovery -h) im seeing that the particular port is on:
| Protocol | ifName | Remote: hostname | port | platform | version | +----------+------------------ +----------------------------- ---------+-------------------- -----+----------------------+- ------------------------------ -----------+ | CDP | mgmt0 | JAYNET01A | mgmt0 | N5K-C5548UP | Cisco Nexus Operating System (NX-OS) ... |
So where could be the problem ?
On Tue, Dec 12, 2017 at 4:33 PM, Edvinas K edvinas.email@gmail.com wrote:
/opt/observium/poller-wrapper. py --host jayxxx /opt/observium/poller-wrapper. py:568: Warning: Data truncated for column 'process_name' at row 1 cursor.execute(p_query, (pid,ppid,processname,uid,comm and,s_time)) INFO: starting the poller at 2017/12/12 15:29:01 with 16 threads /usr/bin/env php /opt/observium/poller.php -q -h 223 >> /dev/null 2>&1 INFO: starting alerter.php for 223 INFO: finished alerter.php for 223 INFO: worker Thread-1 finished device 223 in 141 seconds INFO: poller-wrapper.py poller --host jayxxx processed 1 devices in 141.60 seconds with 16 threads, load average (5min) 1.95
Number of rows updated: 1
here the observium.log information:
infra [root@observ001prvitx logs]# cat observium.log | grep jayxxx | tail -30 [2017/12/12 12:27:38 +0000] poller.php(26069): /opt/observium/poller.php: jayxxx - 1 devices polled in 156.5 secs [2017/12/12 12:32:38 +0000] poller.php(27576): /opt/observium/poller.php: jayxxx - 1 devices polled in 155.8 secs [2017/12/12 12:37:39 +0000] poller.php(24853): /opt/observium/poller.php: jayxxx - 1 devices polled in 157.5 secs [2017/12/12 12:42:36 +0000] poller.php(31743): /opt/observium/poller.php: jayxxx - 1 devices polled in 155.1 secs [2017/12/12 12:47:35 +0000] poller.php(918): /opt/observium/poller.php: jayxxx - 1 devices polled in 154.1 secs [2017/12/12 12:52:34 +0000] poller.php(2685): /opt/observium/poller.php: jayxxx - 1 devices polled in 152.7 secs [2017/12/12 12:57:33 +0000] poller.php(6267): /opt/observium/poller.php: jayxxx - 1 devices polled in 151.7 secs [2017/12/12 13:02:30 +0000] poller.php(11093): /opt/observium/poller.php: jayxxx - 1 devices polled in 148.2 secs [2017/12/12 13:07:37 +0000] poller.php(14342): /opt/observium/poller.php: jayxxx - 1 devices polled in 155.0 secs [2017/12/12 13:12:20 +0000] poller.php(17116): /opt/observium/poller.php: jayxxx - 1 devices polled in 138.3 secs [2017/12/12 13:17:12 +0000] poller.php(18797): /opt/observium/poller.php: jayxxx - 1 devices polled in 129.9 secs [2017/12/12 13:22:29 +0000] discovery.php(18423): /opt/observium/discovery.php: jayxxx - 1 devices discovered in 178.5 secs [2017/12/12 13:22:47 +0000] poller.php(25318): /opt/observium/poller.php: jayxxx - 1 devices polled in 166.0 secs [2017/12/12 13:27:35 +0000] poller.php(27070): /opt/observium/poller.php: jayxxx - 1 devices polled in 153.2 secs [2017/12/12 13:32:22 +0000] poller.php(28740): /opt/observium/poller.php: jayxxx - 1 devices polled in 140.1 secs [2017/12/12 13:37:19 +0000] poller.php(31747): /opt/observium/poller.php: jayxxx - 1 devices polled in 137.1 secs [2017/12/12 13:42:18 +0000] discovery.php(14545): /opt/observium/discovery.php: jayxxx - 1 devices discovered in 206.4 secs [2017/12/12 13:42:39 +0000] poller.php(2225): /opt/observium/poller.php: jayxxx - 1 devices polled in 157.0 secs [2017/12/12 13:47:31 +0000] poller.php(5992): /opt/observium/poller.php: jayxxx - 1 devices polled in 149.2 secs [2017/12/12 13:52:21 +0000] poller.php(8767): /opt/observium/poller.php: jayxxx - 1 devices polled in 139.3 secs [2017/12/12 13:55:21 +0000] poller.php(18678): /opt/observium/poller.php: jayxxx - 1 devices polled in 129.5 secs [2017/12/12 13:57:16 +0000] poller.php(10836): /opt/observium/poller.php: jayxxx - 1 devices polled in 134.1 secs [2017/12/12 14:02:34 +0000] poller.php(14434): /opt/observium/poller.php: jayxxx - 1 devices polled in 152.4 secs [2017/12/12 14:07:16 +0000] poller.php(16199): /opt/observium/poller.php: jayxxx - 1 devices polled in 134.4 secs [2017/12/12 14:12:22 +0000] poller.php(18143): /opt/observium/poller.php: jayxxx - 1 devices polled in 140.1 secs [2017/12/12 14:17:17 +0000] poller.php(19794): /opt/observium/poller.php: jayxxx - 1 devices polled in 134.8 secs [2017/12/12 14:22:20 +0000] poller.php(22296): /opt/observium/poller.php: jayxxx - 1 devices polled in 138.0 secs [2017/12/12 14:27:13 +0000] poller.php(25090): /opt/observium/poller.php: jayxxx - 1 devices polled in 131.4 secs [2017/12/12 14:31:22 +0000] poller.php(9089): /opt/observium/poller.php: jayxxx - 1 devices polled in 141.0 secs [2017/12/12 14:32:30 +0000] poller.php(26759): /opt/observium/poller.php: jayxxx - 1 devices polled in 148.5 secs infra [root@observ001prvitx logs]#
On Tue, Dec 12, 2017 at 4:26 PM, Markus Klock < markus@best-practice.se> wrote:
> and no eventlog entry about snmpwalk timeout? > > /Markus > > 2017-12-12 15:21 GMT+01:00 Edvinas K edvinas.email@gmail.com: > >> I did a manual poller-wrapper and sicovery on it - but still, i >> dont see a port (entity) in alert checker. >> >> Alo attaching a Screenshot: >> >> >> >> [image: Inline image 1] >> >> On Tue, Dec 12, 2017 at 3:58 PM, Markus Klock < >> markus@best-practice.se> wrote: >> >>> Can you screenshot the Performance Data of that device? Cog-wheel >>> at the top right on the device-page. >>> Cisco Nexus have a pretty bad SNMP-stack. >>> /Markus >>> >>> 2017-12-12 14:45 GMT+01:00 Edvinas K edvinas.email@gmail.com: >>> >>>> I did a manual discover (Discovery time - 206.3) but it still >>>> marked as deleted: >>>> >>>> 2017-12-12 14:42:05 Interface was marked as DELETED < after my >>>> discover. >>>> 2017-12-12 14:26:32 Interface DELETED mark removed >>>> 2017-12-12 14:22:16 Interface was marked as DELETED >>>> 2017-12-12 14:06:33 Interface DELETED mark removed >>>> 2017-12-12 14:01:56 Interface was marked as DELETED >>>> 2017-12-12 09:56:36 Interface changed: [ifAlias] '' -> 'vPC >>>> Keep-alive link' >>>> >>>> What's wrong ? >>>> >>>> >>>> >>>> On Tue, Dec 12, 2017 at 3:22 PM, Adam Armstrong < >>>> adama@observium.org> wrote: >>>> >>>>> Hi, >>>>> >>>>> Alert (and group) associations are rebuilt directly after a >>>>> device discovery, so if during a discovery some ports are removed or their >>>>> ifType/ifAlias is returned black because of timed out snmp, they'll drop >>>>> off this checker. >>>>> >>>>> Do you see the ifType/Alias being changed in the entity's logs? >>>>> >>>>> adam. >>>>> >>>>> On 2017-12-12 13:09:15, Edvinas K edvinas.email@gmail.com >>>>> wrote: >>>>> Hello, >>>>> >>>>> I've created alarm checker: >>>>> >>>>> os equals nxos >>>>> hostname match *NET* >>>>> >>>>> ifType equals ethernetCsmacd >>>>> ifAlias match *vPC Keep-alive link* >>>>> >>>>> >>>>> And after a while i noticed that some entities where disapeared. >>>>> The device was reachable and etc. >>>>> I did a "rebuild' and they're reappeared again. What could be >>>>> the cause ? NXOS ? :) >>>>> ______________________________ _________________ observium >>>>> mailing list observium@observium.org >>>>> http://postman.memetic.org/cgi-bin/mailman/listinfo/observium >>>>> >>>>> >>>>> ______________________________ _________________ >>>>> observium mailing list >>>>> observium@observium.org >>>>> http://postman.memetic.org/cgi-bin/mailman/listinfo/observium >>>>> >>>>> >>>> >>>> ______________________________ _________________ >>>> observium mailing list >>>> observium@observium.org >>>> http://postman.memetic.org/cgi-bin/mailman/listinfo/observium >>>> >>>> >>> >>> ______________________________ _________________ >>> observium mailing list >>> observium@observium.org >>> http://postman.memetic.org/cgi-bin/mailman/listinfo/observium >>> >>> >> >> ______________________________ _________________ >> observium mailing list >> observium@observium.org >> http://postman.memetic.org/cgi-bin/mailman/listinfo/observium >> >> > > ______________________________ _________________ > observium mailing list > observium@observium.org > http://postman.memetic.org/cgi-bin/mailman/listinfo/observium > >
observium mailing list observium@observium.org http://postman.memetic.org/cgi-bin/mailman/listinfo/observium
observium mailing list observium@observium.org http://postman.memetic.org/cgi-bin/mailman/listinfo/observium

We have one that runs in our crontab in order to catch any port descriptions that have changed (we have some port status alert conditions that are descr based). Decriptions are only fetched during the discovery process... so here we are...
# periodically run a rediscover of ports modules with a -r (regenerate alerts) to catch description changes 17 */4 * * root /opt/observium/discovery.php -h all -m ports -r >> /dev/null 2>&1
HTH
Michael
On 19 Dec 2017, at 5:52 pm, Edvinas K edvinas.email@gmail.com wrote:
- could you advice which files to put in the cron - to make auto regenerate works ? Seems like that .php alone doesnt work
#auto regenrate 0 */7 * * * root /opt/observium/html/pages/alert_regenerate.inc.php
- i remember when someone said that after /opt/observium/discovery.php -h all, there should be autoregeneration to - how to check if that really works ?
thank you
On Mon, Dec 18, 2017 at 6:06 PM, Adam Armstrong adama@memetic.org wrote: You could run it half an hour after discovery ends or something.
No risk really, it just might be database intensive.
Adam.
Sent from BlueMail On 18 Dec 2017, at 14:54, Edvinas K <edvinas.email@gmail.com target=_blank>edvinas.email@gmail.com> wrote: since only after the manual "alert regenrate" the missing ports starts to appear, i want to ask you.
Do you see any risks in putting the /opt/observium/html/pages/alert_regenerate.inc.php script in a cron tab and run in for example every ~3 hours ?
Thanks
On Fri, Dec 15, 2017 at 12:00 PM, Edvinas K edvinas.email@gmail.com wrote: update:
after i DO:
/opt/observium/discovery.php -h jayXXX
##### Finished discovery run at 2017-12-15 09:57:03 #####
o Devices Discovered 1 o Discovery Time 249.8 secs o Memory usage 34MB (peak: 34MB) o MySQL Usage Cell[547/0.319s] Row[1739/1.934s] Rows[96/0.117s] Column[0/0s] Update[82/0.164s] Insert[2104/7.92s] Delete[6/0.023s]
i got this information which says that SNMP walk is OK.
And after that in port event log i see:
2017-12-15 10:55:30 Interface was marked as DELETED
why is that ?
On Wed, Dec 13, 2017 at 10:44 AM, Edvinas K edvinas.email@gmail.com wrote: p.s after "alert regeneration" for sometime it's ok.
Somewhere i saw that after automatic disovery (discovery.php -h all) ? alerts should be regenerated ? is this still true?
Maybe there are some other command line to do only alarm regeneration - for example every 3 hours.
On Wed, Dec 13, 2017 at 10:02 AM, Edvinas K edvinas.email@gmail.com wrote: so where coud be a problem ?
Poller.php polls in quite normal time:
[2017/12/13 07:37:30 +0000] poller.php(28605): /opt/observium/poller.php: jaynetxxx - 1 devices polled in 148.7 secs [2017/12/13 07:42:22 +0000] poller.php(30304): /opt/observium/poller.php: jaynetxxx - 1 devices polled in 140.3 secs [2017/12/13 07:47:28 +0000] poller.php(2525): /opt/observium/poller.php: jaynetxxx - 1 devices polled in 147.1 secs [2017/12/13 07:52:27 +0000] poller.php(6010): /opt/observium/poller.php: jaynetxxx - 1 devices polled in 145.6 secs
Disovery process (which is snmpwalk ?) completes the job in: 235.2 seconds
Device SNMP seetings: Max repetitions is set to: 20 .
For example the the port is marked as deleted:
but the traffic graphs are still shown:
When device is discovering (discovery -h) im seeing that the particular port is on:
| Protocol | ifName | Remote: hostname | port | platform | version | +----------+------------------ +----------------------------- ---------+-------------------- -----+----------------------+- ------------------------------ -----------+ | CDP | mgmt0 | JAYNET01A | mgmt0 | N5K-C5548UP | Cisco Nexus Operating System (NX-OS) ... |
So where could be the problem ?
On Tue, Dec 12, 2017 at 4:33 PM, Edvinas K edvinas.email@gmail.com wrote: /opt/observium/poller-wrapper. py --host jayxxx /opt/observium/poller-wrapper. py:568: Warning: Data truncated for column 'process_name' at row 1 cursor.execute(p_query, (pid,ppid,processname,uid,comm and,s_time)) INFO: starting the poller at 2017/12/12 15:29:01 with 16 threads /usr/bin/env php /opt/observium/poller.php -q -h 223 >> /dev/null 2>&1 INFO: starting alerter.php for 223 INFO: finished alerter.php for 223 INFO: worker Thread-1 finished device 223 in 141 seconds INFO: poller-wrapper.py poller --host jayxxx processed 1 devices in 141.60 seconds with 16 threads, load average (5min) 1.95
Number of rows updated: 1
here the observium.log information:
infra [root@observ001prvitx logs]# cat observium.log | grep jayxxx | tail -30 [2017/12/12 12:27:38 +0000] poller.php(26069): /opt/observium/poller.php: jayxxx - 1 devices polled in 156.5 secs [2017/12/12 12:32:38 +0000] poller.php(27576): /opt/observium/poller.php: jayxxx - 1 devices polled in 155.8 secs [2017/12/12 12:37:39 +0000] poller.php(24853): /opt/observium/poller.php: jayxxx - 1 devices polled in 157.5 secs [2017/12/12 12:42:36 +0000] poller.php(31743): /opt/observium/poller.php: jayxxx - 1 devices polled in 155.1 secs [2017/12/12 12:47:35 +0000] poller.php(918): /opt/observium/poller.php: jayxxx - 1 devices polled in 154.1 secs [2017/12/12 12:52:34 +0000] poller.php(2685): /opt/observium/poller.php: jayxxx - 1 devices polled in 152.7 secs [2017/12/12 12:57:33 +0000] poller.php(6267): /opt/observium/poller.php: jayxxx - 1 devices polled in 151.7 secs [2017/12/12 13:02:30 +0000] poller.php(11093): /opt/observium/poller.php: jayxxx - 1 devices polled in 148.2 secs [2017/12/12 13:07:37 +0000] poller.php(14342): /opt/observium/poller.php: jayxxx - 1 devices polled in 155.0 secs [2017/12/12 13:12:20 +0000] poller.php(17116): /opt/observium/poller.php: jayxxx - 1 devices polled in 138.3 secs [2017/12/12 13:17:12 +0000] poller.php(18797): /opt/observium/poller.php: jayxxx - 1 devices polled in 129.9 secs [2017/12/12 13:22:29 +0000] discovery.php(18423): /opt/observium/discovery.php: jayxxx - 1 devices discovered in 178.5 secs [2017/12/12 13:22:47 +0000] poller.php(25318): /opt/observium/poller.php: jayxxx - 1 devices polled in 166.0 secs [2017/12/12 13:27:35 +0000] poller.php(27070): /opt/observium/poller.php: jayxxx - 1 devices polled in 153.2 secs [2017/12/12 13:32:22 +0000] poller.php(28740): /opt/observium/poller.php: jayxxx - 1 devices polled in 140.1 secs [2017/12/12 13:37:19 +0000] poller.php(31747): /opt/observium/poller.php: jayxxx - 1 devices polled in 137.1 secs [2017/12/12 13:42:18 +0000] discovery.php(14545): /opt/observium/discovery.php: jayxxx - 1 devices discovered in 206.4 secs [2017/12/12 13:42:39 +0000] poller.php(2225): /opt/observium/poller.php: jayxxx - 1 devices polled in 157.0 secs [2017/12/12 13:47:31 +0000] poller.php(5992): /opt/observium/poller.php: jayxxx - 1 devices polled in 149.2 secs [2017/12/12 13:52:21 +0000] poller.php(8767): /opt/observium/poller.php: jayxxx - 1 devices polled in 139.3 secs [2017/12/12 13:55:21 +0000] poller.php(18678): /opt/observium/poller.php: jayxxx - 1 devices polled in 129.5 secs [2017/12/12 13:57:16 +0000] poller.php(10836): /opt/observium/poller.php: jayxxx - 1 devices polled in 134.1 secs [2017/12/12 14:02:34 +0000] poller.php(14434): /opt/observium/poller.php: jayxxx - 1 devices polled in 152.4 secs [2017/12/12 14:07:16 +0000] poller.php(16199): /opt/observium/poller.php: jayxxx - 1 devices polled in 134.4 secs [2017/12/12 14:12:22 +0000] poller.php(18143): /opt/observium/poller.php: jayxxx - 1 devices polled in 140.1 secs [2017/12/12 14:17:17 +0000] poller.php(19794): /opt/observium/poller.php: jayxxx - 1 devices polled in 134.8 secs [2017/12/12 14:22:20 +0000] poller.php(22296): /opt/observium/poller.php: jayxxx - 1 devices polled in 138.0 secs [2017/12/12 14:27:13 +0000] poller.php(25090): /opt/observium/poller.php: jayxxx - 1 devices polled in 131.4 secs [2017/12/12 14:31:22 +0000] poller.php(9089): /opt/observium/poller.php: jayxxx - 1 devices polled in 141.0 secs [2017/12/12 14:32:30 +0000] poller.php(26759): /opt/observium/poller.php: jayxxx - 1 devices polled in 148.5 secs infra [root@observ001prvitx logs]#
On Tue, Dec 12, 2017 at 4:26 PM, Markus Klock markus@best-practice.se wrote: and no eventlog entry about snmpwalk timeout?
/Markus
2017-12-12 15:21 GMT+01:00 Edvinas K edvinas.email@gmail.com: I did a manual poller-wrapper and sicovery on it - but still, i dont see a port (entity) in alert checker.
Alo attaching a Screenshot:
On Tue, Dec 12, 2017 at 3:58 PM, Markus Klock markus@best-practice.se wrote: Can you screenshot the Performance Data of that device? Cog-wheel at the top right on the device-page. Cisco Nexus have a pretty bad SNMP-stack. /Markus
2017-12-12 14:45 GMT+01:00 Edvinas K edvinas.email@gmail.com: I did a manual discover (Discovery time - 206.3) but it still marked as deleted:
2017-12-12 14:42:05 Interface was marked as DELETED < after my discover. 2017-12-12 14:26:32 Interface DELETED mark removed 2017-12-12 14:22:16 Interface was marked as DELETED 2017-12-12 14:06:33 Interface DELETED mark removed 2017-12-12 14:01:56 Interface was marked as DELETED 2017-12-12 09:56:36 Interface changed: [ifAlias] '' -> 'vPC Keep-alive link'
What's wrong ?
On Tue, Dec 12, 2017 at 3:22 PM, Adam Armstrong adama@observium.org wrote: Hi,
Alert (and group) associations are rebuilt directly after a device discovery, so if during a discovery some ports are removed or their ifType/ifAlias is returned black because of timed out snmp, they'll drop off this checker.
Do you see the ifType/Alias being changed in the entity's logs?
adam.
On 2017-12-12 13:09:15, Edvinas K edvinas.email@gmail.com wrote:
Hello,
I've created alarm checker:
os equals nxos hostname match *NET*
ifType equals ethernetCsmacd ifAlias match *vPC Keep-alive link*
And after a while i noticed that some entities where disapeared. The device was reachable and etc. I did a "rebuild' and they're reappeared again. What could be the cause ? NXOS ? :) ______________________________ _________________ observium mailing list observium@observium.org http://postman.memetic.org/cgi-bin/mailman/listinfo/observium
observium mailing list observium@observium.org http://postman.memetic.org/cgi-bin/mailman/listinfo/observium
observium mailing list observium@observium.org http://postman.memetic.org/cgi-bin/mailman/listinfo/observium
observium mailing list observium@observium.org http://postman.memetic.org/cgi-bin/mailman/listinfo/observium
observium mailing list observium@observium.org http://postman.memetic.org/cgi-bin/mailman/listinfo/observium
observium mailing list observium@observium.org http://postman.memetic.org/cgi-bin/mailman/listinfo/observium
observium mailing list observium@observium.org http://postman.memetic.org/cgi-bin/mailman/listinfo/observium
observium mailing list observium@observium.org http://postman.memetic.org/cgi-bin/mailman/listinfo/observium
observium mailing list observium@observium.org http://postman.memetic.org/cgi-bin/mailman/listinfo/observium
As a workaround I did a a discovery.php -all every 4 hours. But the situation is just a little better.
So in summary here whats happens.
2017-12-28 06:01:47 Interface DELETED mark removed 2017-12-28 08:33:00 cron runs discovery.php -all
after discovery was complete - the situation didn't change. The interface is alive and the Observium shows traffic graphs. But it not appeared in alert checker.
Afterwhile checking a log i see this:
2017-12-28 10:37:02 Interface changed: [ifName] '' -> 'mgmt0'; [ifAlias] '' -> 'VPC Keep-alive link'; [ifHighSpeed] '' -> '1000'; [ifPromiscuousMode] '' -> 'false'; [ifConnectorPresent] '' -> 'true' 2017-12-28 10:31:22 Interface changed: [ifName] 'mgmt0' -> NULL; [ifAlias] 'VPC Keep-alive link' -> NULL; [ifHighSpeed] '1000' -> NULL; [ifPromiscuousMode] 'false' -> NULL; [ifConnectorPresent] 'true' -> NULL
still no info in alert checker.
But the strange thing is that in some alert checkers that interface appears. But if i do "regenerate" alert it comes to checker again and for sometime it's OK.
How could I improve the situation or give you more information - maybe this is somekind of bug ?
On Tue, Dec 19, 2017 at 8:52 AM, Edvinas K edvinas.email@gmail.com wrote:
- could you advice which files to put in the cron - to make auto
regenerate works ? Seems like that .php alone doesnt work
#auto regenrate 0 */7 * * * root /opt/observium/html/pages/alert_regenerate.inc.php
- i remember when someone said that after /opt/observium/discovery.php -h
all, there should be autoregeneration to - how to check if that really works ?
thank you
On Mon, Dec 18, 2017 at 6:06 PM, Adam Armstrong adama@memetic.org wrote:
You could run it half an hour after discovery ends or something.
No risk really, it just might be database intensive.
Adam.
Sent from BlueMail http://www.bluemail.me/r?b=11327 On 18 Dec 2017, at 14:54, Edvinas K <edvinas.email <%3Ca>@gmail.com target=_blank>edvinas.email@gmail.com> wrote:
since only after the manual "alert regenrate" the missing ports starts to appear, i want to ask you.
Do you see any risks in putting the /opt/observium/html/pages/alert_regenerate.inc.php script in a cron tab and run in for example every ~3 hours ?
Thanks
On Fri, Dec 15, 2017 at 12:00 PM, Edvinas K edvinas.email@gmail.com wrote:
update:
after i DO:
/opt/observium/discovery.php -h jayXXX
##### Finished discovery run at 2017-12-15 09:57:03 #####
o Devices Discovered 1 o Discovery Time 249.8 secs o Memory usage 34MB (peak: 34MB) o MySQL Usage Cell[547/0.319s] Row[1739/1.934s] Rows[96/0.117s] Column[0/0s] Update[82/0.164s] Insert[2104/7.92s] Delete[6/0.023s]
i got this information which says that SNMP walk is OK.
And after that in port event log i see:
2017-12-15 10:55:30 Interface was marked as DELETED
why is that ?
On Wed, Dec 13, 2017 at 10:44 AM, Edvinas K edvinas.email@gmail.com wrote:
p.s after "alert regeneration" for sometime it's ok.
Somewhere i saw that after automatic disovery (discovery.php -h all) ? alerts should be regenerated ? is this still true?
Maybe there are some other command line to do only alarm regeneration
- for example every 3 hours.
On Wed, Dec 13, 2017 at 10:02 AM, Edvinas K edvinas.email@gmail.com wrote:
so where coud be a problem ?
Poller.php polls in quite normal time:
[2017/12/13 07:37:30 +0000] poller.php(28605): /opt/observium/poller.php: jaynetxxx - 1 devices polled in 148.7 secs [2017/12/13 07:42:22 +0000] poller.php(30304): /opt/observium/poller.php: jaynetxxx - 1 devices polled in 140.3 secs [2017/12/13 07:47:28 +0000] poller.php(2525): /opt/observium/poller.php: jaynetxxx - 1 devices polled in 147.1 secs [2017/12/13 07:52:27 +0000] poller.php(6010): /opt/observium/poller.php: jaynetxxx - 1 devices polled in 145.6 secs
Disovery process (which is snmpwalk ?) completes the job in: 235.2 seconds
Device SNMP seetings: Max repetitions is set to: 20 .
For example the the port is marked as deleted:
but the traffic graphs are still shown:
[image: Inline image 1]
When device is discovering (discovery -h) im seeing that the particular port is on:
| Protocol | ifName | Remote: hostname | port | platform | version | +----------+------------------ +----------------------------- ---------+-------------------- -----+----------------------+- ------------------------------ -----------+ | CDP | mgmt0 | JAYNET01A | mgmt0 | N5K-C5548UP | Cisco Nexus Operating System (NX-OS) ... |
So where could be the problem ?
On Tue, Dec 12, 2017 at 4:33 PM, Edvinas K edvinas.email@gmail.com wrote:
> /opt/observium/poller-wrapper. py --host jayxxx > /opt/observium/poller-wrapper. py:568: Warning: Data truncated for > column 'process_name' at row 1 > cursor.execute(p_query, (pid,ppid,processname,uid,comm > and,s_time)) > INFO: starting the poller at 2017/12/12 15:29:01 with 16 threads > /usr/bin/env php /opt/observium/poller.php -q -h 223 >> /dev/null > 2>&1 > INFO: starting alerter.php for 223 > INFO: finished alerter.php for 223 > INFO: worker Thread-1 finished device 223 in 141 seconds > INFO: poller-wrapper.py poller --host jayxxx processed 1 devices in > 141.60 seconds with 16 threads, load average (5min) 1.95 > > Number of rows updated: 1 > > here the observium.log information: > > > infra [root@observ001prvitx logs]# cat observium.log | grep jayxxx > | tail -30 > [2017/12/12 12:27:38 +0000] poller.php(26069): > /opt/observium/poller.php: jayxxx - 1 devices polled in 156.5 secs > [2017/12/12 12:32:38 +0000] poller.php(27576): > /opt/observium/poller.php: jayxxx - 1 devices polled in 155.8 secs > [2017/12/12 12:37:39 +0000] poller.php(24853): > /opt/observium/poller.php: jayxxx - 1 devices polled in 157.5 secs > [2017/12/12 12:42:36 +0000] poller.php(31743): > /opt/observium/poller.php: jayxxx - 1 devices polled in 155.1 secs > [2017/12/12 12:47:35 +0000] poller.php(918): > /opt/observium/poller.php: jayxxx - 1 devices polled in 154.1 secs > [2017/12/12 12:52:34 +0000] poller.php(2685): > /opt/observium/poller.php: jayxxx - 1 devices polled in 152.7 secs > [2017/12/12 12:57:33 +0000] poller.php(6267): > /opt/observium/poller.php: jayxxx - 1 devices polled in 151.7 secs > [2017/12/12 13:02:30 +0000] poller.php(11093): > /opt/observium/poller.php: jayxxx - 1 devices polled in 148.2 secs > [2017/12/12 13:07:37 +0000] poller.php(14342): > /opt/observium/poller.php: jayxxx - 1 devices polled in 155.0 secs > [2017/12/12 13:12:20 +0000] poller.php(17116): > /opt/observium/poller.php: jayxxx - 1 devices polled in 138.3 secs > [2017/12/12 13:17:12 +0000] poller.php(18797): > /opt/observium/poller.php: jayxxx - 1 devices polled in 129.9 secs > [2017/12/12 13:22:29 +0000] discovery.php(18423): > /opt/observium/discovery.php: jayxxx - 1 devices discovered in 178.5 secs > [2017/12/12 13:22:47 +0000] poller.php(25318): > /opt/observium/poller.php: jayxxx - 1 devices polled in 166.0 secs > [2017/12/12 13:27:35 +0000] poller.php(27070): > /opt/observium/poller.php: jayxxx - 1 devices polled in 153.2 secs > [2017/12/12 13:32:22 +0000] poller.php(28740): > /opt/observium/poller.php: jayxxx - 1 devices polled in 140.1 secs > [2017/12/12 13:37:19 +0000] poller.php(31747): > /opt/observium/poller.php: jayxxx - 1 devices polled in 137.1 secs > [2017/12/12 13:42:18 +0000] discovery.php(14545): > /opt/observium/discovery.php: jayxxx - 1 devices discovered in 206.4 secs > [2017/12/12 13:42:39 +0000] poller.php(2225): > /opt/observium/poller.php: jayxxx - 1 devices polled in 157.0 secs > [2017/12/12 13:47:31 +0000] poller.php(5992): > /opt/observium/poller.php: jayxxx - 1 devices polled in 149.2 secs > [2017/12/12 13:52:21 +0000] poller.php(8767): > /opt/observium/poller.php: jayxxx - 1 devices polled in 139.3 secs > [2017/12/12 13:55:21 +0000] poller.php(18678): > /opt/observium/poller.php: jayxxx - 1 devices polled in 129.5 secs > [2017/12/12 13:57:16 +0000] poller.php(10836): > /opt/observium/poller.php: jayxxx - 1 devices polled in 134.1 secs > [2017/12/12 14:02:34 +0000] poller.php(14434): > /opt/observium/poller.php: jayxxx - 1 devices polled in 152.4 secs > [2017/12/12 14:07:16 +0000] poller.php(16199): > /opt/observium/poller.php: jayxxx - 1 devices polled in 134.4 secs > [2017/12/12 14:12:22 +0000] poller.php(18143): > /opt/observium/poller.php: jayxxx - 1 devices polled in 140.1 secs > [2017/12/12 14:17:17 +0000] poller.php(19794): > /opt/observium/poller.php: jayxxx - 1 devices polled in 134.8 secs > [2017/12/12 14:22:20 +0000] poller.php(22296): > /opt/observium/poller.php: jayxxx - 1 devices polled in 138.0 secs > [2017/12/12 14:27:13 +0000] poller.php(25090): > /opt/observium/poller.php: jayxxx - 1 devices polled in 131.4 secs > [2017/12/12 14:31:22 +0000] poller.php(9089): > /opt/observium/poller.php: jayxxx - 1 devices polled in 141.0 secs > [2017/12/12 14:32:30 +0000] poller.php(26759): > /opt/observium/poller.php: jayxxx - 1 devices polled in 148.5 secs > infra [root@observ001prvitx logs]# > > > On Tue, Dec 12, 2017 at 4:26 PM, Markus Klock < > markus@best-practice.se> wrote: > >> and no eventlog entry about snmpwalk timeout? >> >> /Markus >> >> 2017-12-12 15:21 GMT+01:00 Edvinas K edvinas.email@gmail.com: >> >>> I did a manual poller-wrapper and sicovery on it - but still, i >>> dont see a port (entity) in alert checker. >>> >>> Alo attaching a Screenshot: >>> >>> >>> >>> [image: Inline image 1] >>> >>> On Tue, Dec 12, 2017 at 3:58 PM, Markus Klock < >>> markus@best-practice.se> wrote: >>> >>>> Can you screenshot the Performance Data of that device? Cog-wheel >>>> at the top right on the device-page. >>>> Cisco Nexus have a pretty bad SNMP-stack. >>>> /Markus >>>> >>>> 2017-12-12 14:45 GMT+01:00 Edvinas K edvinas.email@gmail.com: >>>> >>>>> I did a manual discover (Discovery time - 206.3) but it still >>>>> marked as deleted: >>>>> >>>>> 2017-12-12 14:42:05 Interface was marked as DELETED < after my >>>>> discover. >>>>> 2017-12-12 14:26:32 Interface DELETED mark removed >>>>> 2017-12-12 14:22:16 Interface was marked as DELETED >>>>> 2017-12-12 14:06:33 Interface DELETED mark removed >>>>> 2017-12-12 14:01:56 Interface was marked as DELETED >>>>> 2017-12-12 09:56:36 Interface changed: [ifAlias] '' -> 'vPC >>>>> Keep-alive link' >>>>> >>>>> What's wrong ? >>>>> >>>>> >>>>> >>>>> On Tue, Dec 12, 2017 at 3:22 PM, Adam Armstrong < >>>>> adama@observium.org> wrote: >>>>> >>>>>> Hi, >>>>>> >>>>>> Alert (and group) associations are rebuilt directly after a >>>>>> device discovery, so if during a discovery some ports are removed or their >>>>>> ifType/ifAlias is returned black because of timed out snmp, they'll drop >>>>>> off this checker. >>>>>> >>>>>> Do you see the ifType/Alias being changed in the entity's logs? >>>>>> >>>>>> adam. >>>>>> >>>>>> On 2017-12-12 13:09:15, Edvinas K edvinas.email@gmail.com >>>>>> wrote: >>>>>> Hello, >>>>>> >>>>>> I've created alarm checker: >>>>>> >>>>>> os equals nxos >>>>>> hostname match *NET* >>>>>> >>>>>> ifType equals ethernetCsmacd >>>>>> ifAlias match *vPC Keep-alive link* >>>>>> >>>>>> >>>>>> And after a while i noticed that some entities where >>>>>> disapeared. The device was reachable and etc. >>>>>> I did a "rebuild' and they're reappeared again. What could be >>>>>> the cause ? NXOS ? :) >>>>>> ______________________________ _________________ observium >>>>>> mailing list observium@observium.org >>>>>> http://postman.memetic.org/cgi-bin/mailman/listinfo/observium >>>>>> >>>>>> >>>>>> ______________________________ _________________ >>>>>> observium mailing list >>>>>> observium@observium.org >>>>>> http://postman.memetic.org/cgi-bin/mailman/listinfo/observium >>>>>> >>>>>> >>>>> >>>>> ______________________________ _________________ >>>>> observium mailing list >>>>> observium@observium.org >>>>> http://postman.memetic.org/cgi-bin/mailman/listinfo/observium >>>>> >>>>> >>>> >>>> ______________________________ _________________ >>>> observium mailing list >>>> observium@observium.org >>>> http://postman.memetic.org/cgi-bin/mailman/listinfo/observium >>>> >>>> >>> >>> ______________________________ _________________ >>> observium mailing list >>> observium@observium.org >>> http://postman.memetic.org/cgi-bin/mailman/listinfo/observium >>> >>> >> >> ______________________________ _________________ >> observium mailing list >> observium@observium.org >> http://postman.memetic.org/cgi-bin/mailman/listinfo/observium >> >> >
observium mailing list observium@observium.org http://postman.memetic.org/cgi-bin/mailman/listinfo/observium
observium mailing list observium@observium.org http://postman.memetic.org/cgi-bin/mailman/listinfo/observium
participants (5)
-
 Adam Armstrong
 -
 Adam Armstrong
 -
 Edvinas K
 -
 Markus Klock
 -
 Michael