
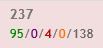
Hello, I was just wondering if someone could explain the grey field in the "entities" column on the Alert Checks page. Are these entities that match the alert check filters and simply aren't polled for whatever reason?
For example: [cid:image001.png@01D04055.D8744240] What is the "138" number representing in this case?
Thanks, Dave

Dave,
Indeed - status unknown / not polled (yet).
Tom
On 02/04/2015 04:41 PM, David Roush wrote:
Hello, I was just wondering if someone could explain the grey field in the “entities” column on the Alert Checks page. Are these entities that match the alert check filters and simply aren’t polled for whatever reason?
For example:
What is the “138” number representing in this case?
Thanks,
Dave
observium mailing list observium@observium.org http://postman.memetic.org/cgi-bin/mailman/listinfo/observium
Thanks for the quick response Tom. These numbers stay pretty solid across all of the alert checks, I assume this indicates a potential resource limitation?
Dave
From: observium [mailto:observium-bounces@observium.org] On Behalf Of Tom Laermans Sent: Wednesday, February 4, 2015 8:47 AM To: Observium Network Observation System Subject: Re: [Observium] Alert Checks - color coding
Dave,
Indeed - status unknown / not polled (yet).
Tom
On 02/04/2015 04:41 PM, David Roush wrote: Hello, I was just wondering if someone could explain the grey field in the "entities" column on the Alert Checks page. Are these entities that match the alert check filters and simply aren't polled for whatever reason?
For example: [cid:image001.png@01D04057.EBDB88F0] What is the "138" number representing in this case?
Thanks, Dave
_______________________________________________
observium mailing list
observium@observium.orgmailto:observium@observium.org
http://postman.memetic.org/cgi-bin/mailman/listinfo/observium
David,
It shouldn't be. Either there's a bug, or perhaps you disabled/ignored some ports in Observium? In that case, the poller won't send metrics to the alerter.
Tom
On 02/04/2015 04:52 PM, David Roush wrote:
Thanks for the quick response Tom. These numbers stay pretty solid across all of the alert checks, I assume this indicates a potential resource limitation?
Dave
*From:*observium [mailto:observium-bounces@observium.org] *On Behalf Of *Tom Laermans *Sent:* Wednesday, February 4, 2015 8:47 AM *To:* Observium Network Observation System *Subject:* Re: [Observium] Alert Checks - color coding
Dave,
Indeed - status unknown / not polled (yet).
Tom
On 02/04/2015 04:41 PM, David Roush wrote:
Hello, I was just wondering if someone could explain the grey
field in the “entities” column on the Alert Checks page. Are these
entities that match the alert check filters and simply aren’t
polled for whatever reason?

For example:

What is the “138” number representing in this case?

Thanks,

Dave


_______________________________________________

observium mailing list

observium@observium.org  <mailto:observium@observium.org>

http://postman.memetic.org/cgi-bin/mailman/listinfo/observium
observium mailing list observium@observium.org http://postman.memetic.org/cgi-bin/mailman/listinfo/observium
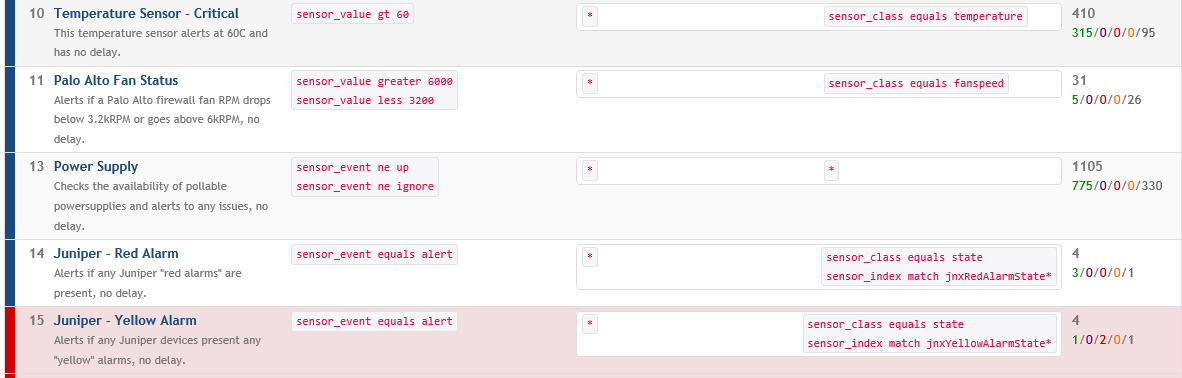
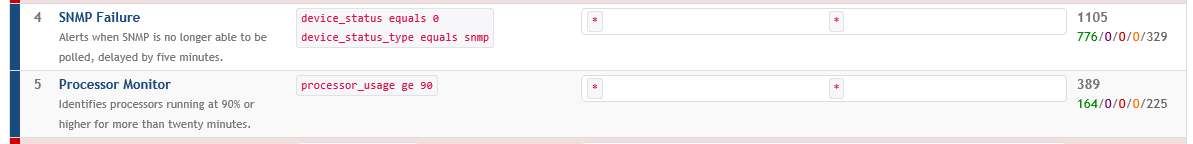
Thanks Tom. There are a large number of disabled ports which would explain the huge numbers I see for checks like "Interface utilization". Here are a few that don't pertain to interfaces:
[cid:image001.png@01D0405A.378769C0] [cid:image002.png@01D0405A.378769C0]
What does this indicate to you? Is there any other information that I can provide would be relevant?
Thanks, Dave
From: observium [mailto:observium-bounces@observium.org] On Behalf Of Tom Laermans Sent: Wednesday, February 4, 2015 9:03 AM To: Observium Network Observation System Subject: Re: [Observium] Alert Checks - color coding
David,
It shouldn't be. Either there's a bug, or perhaps you disabled/ignored some ports in Observium? In that case, the poller won't send metrics to the alerter.
Tom
On 02/04/2015 04:52 PM, David Roush wrote: Thanks for the quick response Tom. These numbers stay pretty solid across all of the alert checks, I assume this indicates a potential resource limitation?
Dave
From: observium [mailto:observium-bounces@observium.org] On Behalf Of Tom Laermans Sent: Wednesday, February 4, 2015 8:47 AM To: Observium Network Observation System Subject: Re: [Observium] Alert Checks - color coding
Dave,
Indeed - status unknown / not polled (yet).
Tom
On 02/04/2015 04:41 PM, David Roush wrote: Hello, I was just wondering if someone could explain the grey field in the "entities" column on the Alert Checks page. Are these entities that match the alert check filters and simply aren't polled for whatever reason?
For example: [cid:image003.png@01D0405A.378769C0] What is the "138" number representing in this case?
Thanks, Dave
_______________________________________________
observium mailing list
observium@observium.orgmailto:observium@observium.org
http://postman.memetic.org/cgi-bin/mailman/listinfo/observium
_______________________________________________
observium mailing list
observium@observium.orgmailto:observium@observium.org
http://postman.memetic.org/cgi-bin/mailman/listinfo/observium

This is probably caused by insufficient mysql heap space.
Adam.
Sent with AquaMail for Android http://www.aqua-mail.com
On 4 February 2015 10:14:37 David Roush DRoush@denovo-us.com wrote:
Thanks Tom. There are a large number of disabled ports which would explain the huge numbers I see for checks like "Interface utilization". Here are a few that don't pertain to interfaces:
[cid:image001.png@01D0405A.378769C0] [cid:image002.png@01D0405A.378769C0]
What does this indicate to you? Is there any other information that I can provide would be relevant?
Thanks, Dave
From: observium [mailto:observium-bounces@observium.org] On Behalf Of Tom Laermans Sent: Wednesday, February 4, 2015 9:03 AM To: Observium Network Observation System Subject: Re: [Observium] Alert Checks - color coding
David,
It shouldn't be. Either there's a bug, or perhaps you disabled/ignored some ports in Observium? In that case, the poller won't send metrics to the alerter.
Tom
On 02/04/2015 04:52 PM, David Roush wrote: Thanks for the quick response Tom. These numbers stay pretty solid across all of the alert checks, I assume this indicates a potential resource limitation?
Dave
From: observium [mailto:observium-bounces@observium.org] On Behalf Of Tom Laermans Sent: Wednesday, February 4, 2015 8:47 AM To: Observium Network Observation System Subject: Re: [Observium] Alert Checks - color coding
Dave,
Indeed - status unknown / not polled (yet).
Tom
On 02/04/2015 04:41 PM, David Roush wrote: Hello, I was just wondering if someone could explain the grey field in the "entities" column on the Alert Checks page. Are these entities that match the alert check filters and simply aren't polled for whatever reason?
For example: [cid:image003.png@01D0405A.378769C0] What is the "138" number representing in this case?
Thanks, Dave
observium mailing list
observium@observium.orgmailto:observium@observium.org
http://postman.memetic.org/cgi-bin/mailman/listinfo/observium
observium mailing list
observium@observium.orgmailto:observium@observium.org
http://postman.memetic.org/cgi-bin/mailman/listinfo/observium
observium mailing list observium@observium.org http://postman.memetic.org/cgi-bin/mailman/listinfo/observium
Good point! Didn't think of that [yet].
We should store or check that somewhere so we can alert people on it using the alert thing in the bottom bar.
Tom
On 02/04/2015 05:34 PM, Adam Armstrong wrote:
This is probably caused by insufficient mysql heap space.
Adam.
Sent with AquaMail for Android http://www.aqua-mail.com
On 4 February 2015 10:14:37 David Roush DRoush@denovo-us.com wrote:
Thanks Tom. There are a large number of disabled ports which would explain the huge numbers I see for checks like “Interface utilization”. Here are a few that don’t pertain to interfaces:
What does this indicate to you? Is there any other information that I can provide would be relevant?
Thanks,
Dave
*From:*observium [mailto:observium-bounces@observium.org] *On Behalf Of *Tom Laermans *Sent:* Wednesday, February 4, 2015 9:03 AM *To:* Observium Network Observation System *Subject:* Re: [Observium] Alert Checks - color coding
David,
It shouldn't be. Either there's a bug, or perhaps you disabled/ignored some ports in Observium? In that case, the poller won't send metrics to the alerter.
Tom
On 02/04/2015 04:52 PM, David Roush wrote:
Thanks for the quick response Tom. These numbers stay pretty
solid across all of the alert checks, I assume this indicates a
potential resource limitation?

Dave

*From:*observium [mailto:observium-bounces@observium.org] *On
Behalf Of *Tom Laermans
*Sent:* Wednesday, February 4, 2015 8:47 AM
*To:* Observium Network Observation System
*Subject:* Re: [Observium] Alert Checks - color coding

Dave,

Indeed - status unknown / not polled (yet).

Tom

On 02/04/2015 04:41 PM, David Roush wrote:

    Hello, I was just wondering if someone could explain the grey
    field in the “entities” column on the Alert Checks page. Are
    these entities that match the alert check filters and simply
    aren’t polled for whatever reason?

    For example:

    What is the “138” number representing in this case?

    Thanks,

    Dave


    _______________________________________________

    observium mailing list

    observium@observium.org  <mailto:observium@observium.org>

    http://postman.memetic.org/cgi-bin/mailman/listinfo/observium


_______________________________________________

observium mailing list

observium@observium.org  <mailto:observium@observium.org>

http://postman.memetic.org/cgi-bin/mailman/listinfo/observium
observium mailing list observium@observium.org http://postman.memetic.org/cgi-bin/mailman/listinfo/observium
observium mailing list observium@observium.org http://postman.memetic.org/cgi-bin/mailman/listinfo/observium
That fixed it! Thank you guys for the help, it is much appreciated.
Dave
From: observium [mailto:observium-bounces@observium.org] On Behalf Of Tom Laermans Sent: Wednesday, February 4, 2015 9:36 AM To: Observium Network Observation System Subject: Re: [Observium] Alert Checks - color coding
Good point! Didn't think of that [yet].
We should store or check that somewhere so we can alert people on it using the alert thing in the bottom bar.
Tom
On 02/04/2015 05:34 PM, Adam Armstrong wrote:
This is probably caused by insufficient mysql heap space.
Adam.
Sent with AquaMail for Android http://www.aqua-mail.com
On 4 February 2015 10:14:37 David Roush DRoush@denovo-us.commailto:DRoush@denovo-us.com wrote: Thanks Tom. There are a large number of disabled ports which would explain the huge numbers I see for checks like "Interface utilization". Here are a few that don't pertain to interfaces:
[cid:image001.png@01D04062.7FAAB150] [cid:image002.png@01D04062.7FAAB150]
What does this indicate to you? Is there any other information that I can provide would be relevant?
Thanks, Dave
From: observium [mailto:observium-bounces@observium.org] On Behalf Of Tom Laermans Sent: Wednesday, February 4, 2015 9:03 AM To: Observium Network Observation System Subject: Re: [Observium] Alert Checks - color coding
David,
It shouldn't be. Either there's a bug, or perhaps you disabled/ignored some ports in Observium? In that case, the poller won't send metrics to the alerter.
Tom
On 02/04/2015 04:52 PM, David Roush wrote: Thanks for the quick response Tom. These numbers stay pretty solid across all of the alert checks, I assume this indicates a potential resource limitation?
Dave
From: observium [mailto:observium-bounces@observium.org] On Behalf Of Tom Laermans Sent: Wednesday, February 4, 2015 8:47 AM To: Observium Network Observation System Subject: Re: [Observium] Alert Checks - color coding
Dave,
Indeed - status unknown / not polled (yet).
Tom
On 02/04/2015 04:41 PM, David Roush wrote: Hello, I was just wondering if someone could explain the grey field in the "entities" column on the Alert Checks page. Are these entities that match the alert check filters and simply aren't polled for whatever reason?
For example: [cid:image003.png@01D04062.7FAAB150] What is the "138" number representing in this case?
Thanks, Dave
_______________________________________________
observium mailing list
observium@observium.orgmailto:observium@observium.org
http://postman.memetic.org/cgi-bin/mailman/listinfo/observium
_______________________________________________
observium mailing list
observium@observium.orgmailto:observium@observium.org
http://postman.memetic.org/cgi-bin/mailman/listinfo/observium
_______________________________________________ observium mailing list observium@observium.orgmailto:observium@observium.org http://postman.memetic.org/cgi-bin/mailman/listinfo/observium
_______________________________________________
observium mailing list
observium@observium.orgmailto:observium@observium.org
http://postman.memetic.org/cgi-bin/mailman/listinfo/observium

I was wondering the same thing about those colored numbers on "Alert Checker" page. I'm still not sure what they all mean!
How do these 5 entries match the 6 "Status Types"?
1049/2/3/0/3
OK
RECOVER_NOTIFY
ALERT_NOTIFY
FAIL
FAIL_DELAYED
FAIL_SUPPRESSED
I can add this to the wiki, but I'd prefer some sort of self-documentation, such as a mouse-over tool-tip.
Thanks!
Tristan
*Tristan Rhodes* Network Engineer Weber State University 801.626.8549
On Wed, Feb 4, 2015 at 8:47 AM, Tom Laermans tom.laermans@powersource.cx wrote:
Dave,
Indeed - status unknown / not polled (yet).
Tom
On 02/04/2015 04:41 PM, David Roush wrote:
Hello, I was just wondering if someone could explain the grey field in the “entities” column on the Alert Checks page. Are these entities that match the alert check filters and simply aren’t polled for whatever reason?
For example:
What is the “138” number representing in this case?
Thanks,
Dave
observium mailing listobservium@observium.orghttp://postman.memetic.org/cgi-bin/mailman/listinfo/observium
observium mailing list observium@observium.org http://postman.memetic.org/cgi-bin/mailman/listinfo/observium

On Wed, Feb 04, 2015 at 04:02:26PM -0700, Tristan Rhodes wrote:
I was wondering the same thing about those colored numbers on "Alert Checker" page. I'm still not sure what they all mean!
How do these 5 entries match the 6 "Status Types"?
1049/2/3/0/3
OK
RECOVER_NOTIFY
ALERT_NOTIFY
FAIL
FAIL_DELAYED
FAIL_SUPPRESSED
I can add this to the wiki, but I'd prefer some sort of self-documentation, such as a mouse-over tool-tip.
Thanks!
Tristan
There is the legend on the Overview/front page but it would definitely be nice to have that info on the other pages as well. As a tooltip, it wouldn't disturb the current page layout. -Nick
the two notify types aren't statuses, they're events. The others are statuses the entry into which are added to the event log as events.
alert_notify obviously only happens when a device enters the fail state, and then every 24 hours after. recover_notify happens when a device enters the ok state from a fail state.
We have a vague scheme for what the colours me :
Blue : ok Green : ok but ignored (in some places, green is used to mean "ok" too, but this might be confusing) Orange : fail but delayed (elsewhere in the UI it means "down because a parent is down" like if a vlan is down because a port is down) Purple : fail but alerting is suppressed (a mix of red and blue, meaning it's down, but you've told observium there is nothing to see here) Red: Fail
To be totally sure what these mean, you sometimes have to look at the code. :D
adam. On 04/02/2015 23:45:08, Nick Schmalenberger nick@schmalenberger.us wrote: On Wed, Feb 04, 2015 at 04:02:26PM -0700, Tristan Rhodes wrote:
I was wondering the same thing about those colored numbers on "Alert Checker" page. I'm still not sure what they all mean!
How do these 5 entries match the 6 "Status Types"?
1049/2/3/0/3
OK
RECOVER_NOTIFY
ALERT_NOTIFY
FAIL
FAIL_DELAYED
FAIL_SUPPRESSED
I can add this to the wiki, but I'd prefer some sort of self-documentation, such as a mouse-over tool-tip.
Thanks!
Tristan
There is the legend on the Overview/front page but it would definitely be nice to have that info on the other pages as well. As a tooltip, it wouldn't disturb the current page layout. -Nick _______________________________________________ observium mailing list observium@observium.org http://postman.memetic.org/cgi-bin/mailman/listinfo/observium
participants (5)
-
 Adam Armstrong
 -
 David Roush
 -
 Nick Schmalenberger
 -
 Tom Laermans
 -
 Tristan Rhodes