Observium wrong graph traffic statistic

Dear Team,
I just install Observium and as I observed the graph traffic statistic seem not accurate compared to my Cacti graph monitoring system then I ask my Network Engineer to check which one is accurate traffic between Observium and Cacti, as the result after checking real traffic on my router device, Observium seems not accurate.
Note: Graph statistic value is different is around 1GB, this is a huge number.
Can anyone explain why or anyone experiences like me?
[image: Inline image 1]
My real Out traffic should be around 5.78GB instead
Thanks so much.

Hi, which graph are you looking at? an overview graph or on a specific interface? what time interval are you looking at? 6h, 24h, 1 week? Can you show us a comparison of the same traffic in cacti?
/Markus
2017-02-07 8:09 GMT+01:00 Sophanith Chhom sophanith.chhom@gmail.com:
Dear Team,
I just install Observium and as I observed the graph traffic statistic seem not accurate compared to my Cacti graph monitoring system then I ask my Network Engineer to check which one is accurate traffic between Observium and Cacti, as the result after checking real traffic on my router device, Observium seems not accurate.
Note: Graph statistic value is different is around 1GB, this is a huge number.
Can anyone explain why or anyone experiences like me?
[image: Inline image 1]
My real Out traffic should be around 5.78GB instead
Thanks so much.
observium mailing list observium@observium.org http://postman.memetic.org/cgi-bin/mailman/listinfo/observium
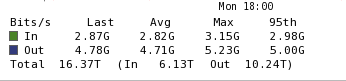
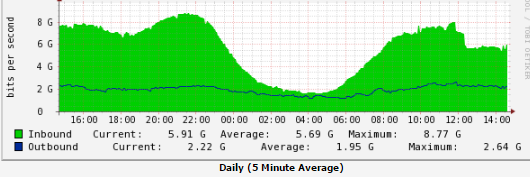
I have looked on some specific interface and found out that it's all different, bellow is the comparison of the same traffic:
[image: Inline image 1]
[image: Inline image 2]
See? current Inbound traffic on Cacti is 5.91GB vs Observium 4.67GB (last)
Thanks
On Tue, Feb 7, 2017 at 2:33 PM, Markus Klock markus@best-practice.se wrote:
Hi, which graph are you looking at? an overview graph or on a specific interface? what time interval are you looking at? 6h, 24h, 1 week? Can you show us a comparison of the same traffic in cacti?
/Markus
2017-02-07 8:09 GMT+01:00 Sophanith Chhom sophanith.chhom@gmail.com:
Dear Team,
I just install Observium and as I observed the graph traffic statistic seem not accurate compared to my Cacti graph monitoring system then I ask my Network Engineer to check which one is accurate traffic between Observium and Cacti, as the result after checking real traffic on my router device, Observium seems not accurate.
Note: Graph statistic value is different is around 1GB, this is a huge number.
Can anyone explain why or anyone experiences like me?
[image: Inline image 1]
My real Out traffic should be around 5.78GB instead
Thanks so much.
observium mailing list observium@observium.org http://postman.memetic.org/cgi-bin/mailman/listinfo/observium
observium mailing list observium@observium.org http://postman.memetic.org/cgi-bin/mailman/listinfo/observium
Hi, I don't think those two graphs show the same interface in the router, all the data is different. Can you show a full screenshot of the whole page for both Observium and Cacti? /Markus
2017-02-07 8:43 GMT+01:00 Sophanith Chhom sophanith.chhom@gmail.com:
I have looked on some specific interface and found out that it's all different, bellow is the comparison of the same traffic:
[image: Inline image 1]
[image: Inline image 2]
See? current Inbound traffic on Cacti is 5.91GB vs Observium 4.67GB (last)
Thanks
On Tue, Feb 7, 2017 at 2:33 PM, Markus Klock markus@best-practice.se wrote:
Hi, which graph are you looking at? an overview graph or on a specific interface? what time interval are you looking at? 6h, 24h, 1 week? Can you show us a comparison of the same traffic in cacti?
/Markus
2017-02-07 8:09 GMT+01:00 Sophanith Chhom sophanith.chhom@gmail.com:
Dear Team,
I just install Observium and as I observed the graph traffic statistic seem not accurate compared to my Cacti graph monitoring system then I ask my Network Engineer to check which one is accurate traffic between Observium and Cacti, as the result after checking real traffic on my router device, Observium seems not accurate.
Note: Graph statistic value is different is around 1GB, this is a huge number.
Can anyone explain why or anyone experiences like me?
[image: Inline image 1]
My real Out traffic should be around 5.78GB instead
Thanks so much.
observium mailing list observium@observium.org http://postman.memetic.org/cgi-bin/mailman/listinfo/observium
observium mailing list observium@observium.org http://postman.memetic.org/cgi-bin/mailman/listinfo/observium
observium mailing list observium@observium.org http://postman.memetic.org/cgi-bin/mailman/listinfo/observium
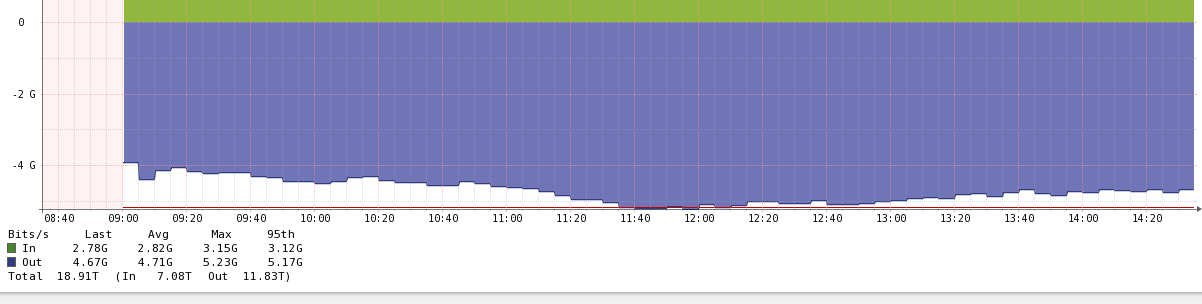
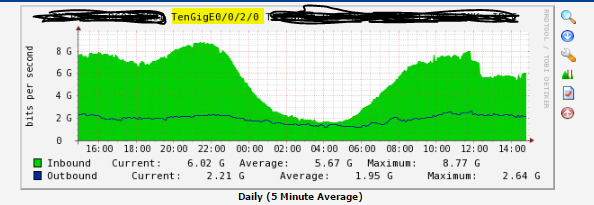
Here is the two of it:
[image: Inline image 1][image: Inline image 2]
See it clear? and believe me it's the same interface on cisco router, I also double check on other interfaces it's not accurate as well.
Thanks so much for help
On Tue, Feb 7, 2017 at 2:54 PM, Markus Klock markus@best-practice.se wrote:
Hi, I don't think those two graphs show the same interface in the router, all the data is different. Can you show a full screenshot of the whole page for both Observium and Cacti? /Markus
2017-02-07 8:43 GMT+01:00 Sophanith Chhom sophanith.chhom@gmail.com:
I have looked on some specific interface and found out that it's all different, bellow is the comparison of the same traffic:
[image: Inline image 1]
[image: Inline image 2]
See? current Inbound traffic on Cacti is 5.91GB vs Observium 4.67GB (last)
Thanks
On Tue, Feb 7, 2017 at 2:33 PM, Markus Klock markus@best-practice.se wrote:
Hi, which graph are you looking at? an overview graph or on a specific interface? what time interval are you looking at? 6h, 24h, 1 week? Can you show us a comparison of the same traffic in cacti?
/Markus
2017-02-07 8:09 GMT+01:00 Sophanith Chhom sophanith.chhom@gmail.com:
Dear Team,
I just install Observium and as I observed the graph traffic statistic seem not accurate compared to my Cacti graph monitoring system then I ask my Network Engineer to check which one is accurate traffic between Observium and Cacti, as the result after checking real traffic on my router device, Observium seems not accurate.
Note: Graph statistic value is different is around 1GB, this is a huge number.
Can anyone explain why or anyone experiences like me?
[image: Inline image 1]
My real Out traffic should be around 5.78GB instead
Thanks so much.
observium mailing list observium@observium.org http://postman.memetic.org/cgi-bin/mailman/listinfo/observium
observium mailing list observium@observium.org http://postman.memetic.org/cgi-bin/mailman/listinfo/observium
observium mailing list observium@observium.org http://postman.memetic.org/cgi-bin/mailman/listinfo/observium
observium mailing list observium@observium.org http://postman.memetic.org/cgi-bin/mailman/listinfo/observium

It's not the same interface. One is showing ~5Gbps of inbound traffic and the other is showing it as outbound traffic.
Is it possible that your cisco router was rebooted recently? Does your router config have 'snmp ifindex persist'? Without that, your interfaces will magically move around with every reboot and both your Observium AND Cacti graphs will be wrong...
Michael
On 7 Feb 2017, at 7:00 pm, Sophanith Chhom sophanith.chhom@gmail.com wrote:
Here is the two of it:
<observium1.PNG><cacti1.PNG>
See it clear? and believe me it's the same interface on cisco router, I also double check on other interfaces it's not accurate as well.
Thanks so much for help
On Tue, Feb 7, 2017 at 2:54 PM, Markus Klock markus@best-practice.se wrote: Hi, I don't think those two graphs show the same interface in the router, all the data is different. Can you show a full screenshot of the whole page for both Observium and Cacti? /Markus
2017-02-07 8:43 GMT+01:00 Sophanith Chhom sophanith.chhom@gmail.com: I have looked on some specific interface and found out that it's all different, bellow is the comparison of the same traffic:
See? current Inbound traffic on Cacti is 5.91GB vs Observium 4.67GB (last)
Thanks
On Tue, Feb 7, 2017 at 2:33 PM, Markus Klock markus@best-practice.se wrote: Hi, which graph are you looking at? an overview graph or on a specific interface? what time interval are you looking at? 6h, 24h, 1 week? Can you show us a comparison of the same traffic in cacti?
/Markus
2017-02-07 8:09 GMT+01:00 Sophanith Chhom sophanith.chhom@gmail.com: Dear Team,
I just install Observium and as I observed the graph traffic statistic seem not accurate compared to my Cacti graph monitoring system then I ask my Network Engineer to check which one is accurate traffic between Observium and Cacti, as the result after checking real traffic on my router device, Observium seems not accurate.
Note: Graph statistic value is different is around 1GB, this is a huge number.
Can anyone explain why or anyone experiences like me?
My real Out traffic should be around 5.78GB instead
Thanks so much.
observium mailing list observium@observium.org http://postman.memetic.org/cgi-bin/mailman/listinfo/observium
observium mailing list observium@observium.org http://postman.memetic.org/cgi-bin/mailman/listinfo/observium
observium mailing list observium@observium.org http://postman.memetic.org/cgi-bin/mailman/listinfo/observium
observium mailing list observium@observium.org http://postman.memetic.org/cgi-bin/mailman/listinfo/observium
observium mailing list observium@observium.org http://postman.memetic.org/cgi-bin/mailman/listinfo/observium
Actually, given the steepness of that uptime graph, this is almost certainly what is taking place.
Add 'snmp ifindex persist' to your routers config, then rediscover. Your Cacti will most likely need to be manually corrected (well, it was all manual the last time I looked at Cacti anyway, which is why we're here!)
On 7 Feb 2017, at 7:06 pm, Michael obslist@smarsz.com wrote:
It's not the same interface. One is showing ~5Gbps of inbound traffic and the other is showing it as outbound traffic.
Is it possible that your cisco router was rebooted recently? Does your router config have 'snmp ifindex persist'? Without that, your interfaces will magically move around with every reboot and both your Observium AND Cacti graphs will be wrong...
Michael
On 7 Feb 2017, at 7:00 pm, Sophanith Chhom sophanith.chhom@gmail.com wrote:
Here is the two of it:
<observium1.PNG><cacti1.PNG>
See it clear? and believe me it's the same interface on cisco router, I also double check on other interfaces it's not accurate as well.
Thanks so much for help
On Tue, Feb 7, 2017 at 2:54 PM, Markus Klock markus@best-practice.se wrote: Hi, I don't think those two graphs show the same interface in the router, all the data is different. Can you show a full screenshot of the whole page for both Observium and Cacti? /Markus
2017-02-07 8:43 GMT+01:00 Sophanith Chhom sophanith.chhom@gmail.com: I have looked on some specific interface and found out that it's all different, bellow is the comparison of the same traffic:
See? current Inbound traffic on Cacti is 5.91GB vs Observium 4.67GB (last)
Thanks
On Tue, Feb 7, 2017 at 2:33 PM, Markus Klock markus@best-practice.se wrote: Hi, which graph are you looking at? an overview graph or on a specific interface? what time interval are you looking at? 6h, 24h, 1 week? Can you show us a comparison of the same traffic in cacti?
/Markus
2017-02-07 8:09 GMT+01:00 Sophanith Chhom sophanith.chhom@gmail.com: Dear Team,
I just install Observium and as I observed the graph traffic statistic seem not accurate compared to my Cacti graph monitoring system then I ask my Network Engineer to check which one is accurate traffic between Observium and Cacti, as the result after checking real traffic on my router device, Observium seems not accurate.
Note: Graph statistic value is different is around 1GB, this is a huge number.
Can anyone explain why or anyone experiences like me?
My real Out traffic should be around 5.78GB instead
Thanks so much.
observium mailing list observium@observium.org http://postman.memetic.org/cgi-bin/mailman/listinfo/observium
observium mailing list observium@observium.org http://postman.memetic.org/cgi-bin/mailman/listinfo/observium
observium mailing list observium@observium.org http://postman.memetic.org/cgi-bin/mailman/listinfo/observium
observium mailing list observium@observium.org http://postman.memetic.org/cgi-bin/mailman/listinfo/observium
observium mailing list observium@observium.org http://postman.memetic.org/cgi-bin/mailman/listinfo/observium
observium mailing list observium@observium.org http://postman.memetic.org/cgi-bin/mailman/listinfo/observium

Anyways is traffic still fine when it goes over 8GB, right? I mean no problem with graph 64bits for Observium?
Becuase it looks strange after traffic goes over 8GB per I noticed (like decrease ).
Thanks, let me keep monitor it more till tomorrow,.
On Tue, Feb 7, 2017 at 3:07 PM, Thomas Nicholson < thomas.nicholson@thebunker.net> wrote:
Your Cacti graph is 24 hours, your Observium graph is 6 hours. Try using the same time period as a comparison :)
On 07/02/17 08:00, Sophanith Chhom wrote:
Here is the two of it:
[image: Inline image 1][image: Inline image 2]
See it clear? and believe me it's the same interface on cisco router, I also double check on other interfaces it's not accurate as well.
Thanks so much for help
On Tue, Feb 7, 2017 at 2:54 PM, Markus Klock markus@best-practice.se wrote:
Hi, I don't think those two graphs show the same interface in the router, all the data is different. Can you show a full screenshot of the whole page for both Observium and Cacti? /Markus
2017-02-07 8:43 GMT+01:00 Sophanith Chhom < sophanith.chhom@gmail.com sophanith.chhom@gmail.com>:
I have looked on some specific interface and found out that it's all different, bellow is the comparison of the same traffic:
[image: Inline image 1]
[image: Inline image 2]
See? current Inbound traffic on Cacti is 5.91GB vs Observium 4.67GB (last)
Thanks
On Tue, Feb 7, 2017 at 2:33 PM, Markus Klock < markus@best-practice.se markus@best-practice.se> wrote:
Hi, which graph are you looking at? an overview graph or on a specific interface? what time interval are you looking at? 6h, 24h, 1 week? Can you show us a comparison of the same traffic in cacti?
/Markus
2017-02-07 8:09 GMT+01:00 Sophanith Chhom < sophanith.chhom@gmail.com sophanith.chhom@gmail.com>:
Dear Team,
I just install Observium and as I observed the graph traffic statistic seem not accurate compared to my Cacti graph monitoring system then I ask my Network Engineer to check which one is accurate traffic between Observium and Cacti, as the result after checking real traffic on my router device, Observium seems not accurate.
Note: Graph statistic value is different is around 1GB, this is a huge number.
Can anyone explain why or anyone experiences like me?
[image: Inline image 1]
My real Out traffic should be around 5.78GB instead
Thanks so much.
observium mailing list observium@observium.org http://postman.memetic.org/cgi-bin/mailman/listinfo/observium
observium mailing list observium@observium.org http://postman.memetic.org/cgi-bin/mailman/listinfo/observium
observium mailing list observium@observium.org http://postman.memetic.org/cgi-bin/mailman/listinfo/observium
observium mailing list observium@observium.org http://postman.memetic.org/cgi-bin/mailman/listinfo/observium
This email has been scanned by the Symantec Email Security.cloud service. For more information please visit http://www.symanteccloud.com ______________________________________________________________________
observium mailing listobservium@observium.orghttp://postman.memetic.org/cgi-bin/mailman/listinfo/observium
-- Thomas Nicholson Senior Network Consultant
The Bunker Ultra Secure Hosting Ash Radar Station, Marshborough Road, Sandwich, Kent, CT13 0PL t: 01304 814800 | w: www.thebunker.net
observium mailing list observium@observium.org http://postman.memetic.org/cgi-bin/mailman/listinfo/observium
Anyways is traffic still fine when it goes over 8GB, right? I mean no problem with graph 64bits for Observium?
Becuase it looks strange after traffic goes over 8GB per I noticed (like decrease ).
32bit counters wrap at the ~100Mb mark, not 8Gb.
You can see if a specific interface is collecting 32bit or 64bit values from the device settings, port page.

Protip: If you think you've discovered a showstopping bug in a decade-old piece of software in its primary reason for existence, you've probably made a user error somewhere. :D
adam. On 07/02/2017 09:08:18, Michael obslist@smarsz.com wrote:
Anyways is traffic still fine when it goes over 8GB, right? I mean no problem with graph 64bits for Observium?
Becuase it looks strange after traffic goes over 8GB per I noticed (like decrease ).
32bit counters wrap at the ~100Mb mark, not 8Gb.
You can see if a specific interface is collecting 32bit or 64bit values from the device settings, port page. _______________________________________________ observium mailing list observium@observium.org http://postman.memetic.org/cgi-bin/mailman/listinfo/observium
participants (5)
-
 Adam Armstrong
 -
 Markus Klock
 -
 Michael
 -
 Sophanith Chhom
 -
 Thomas Nicholson