
I managed to get alerts working and its great. I did have a few questions though.
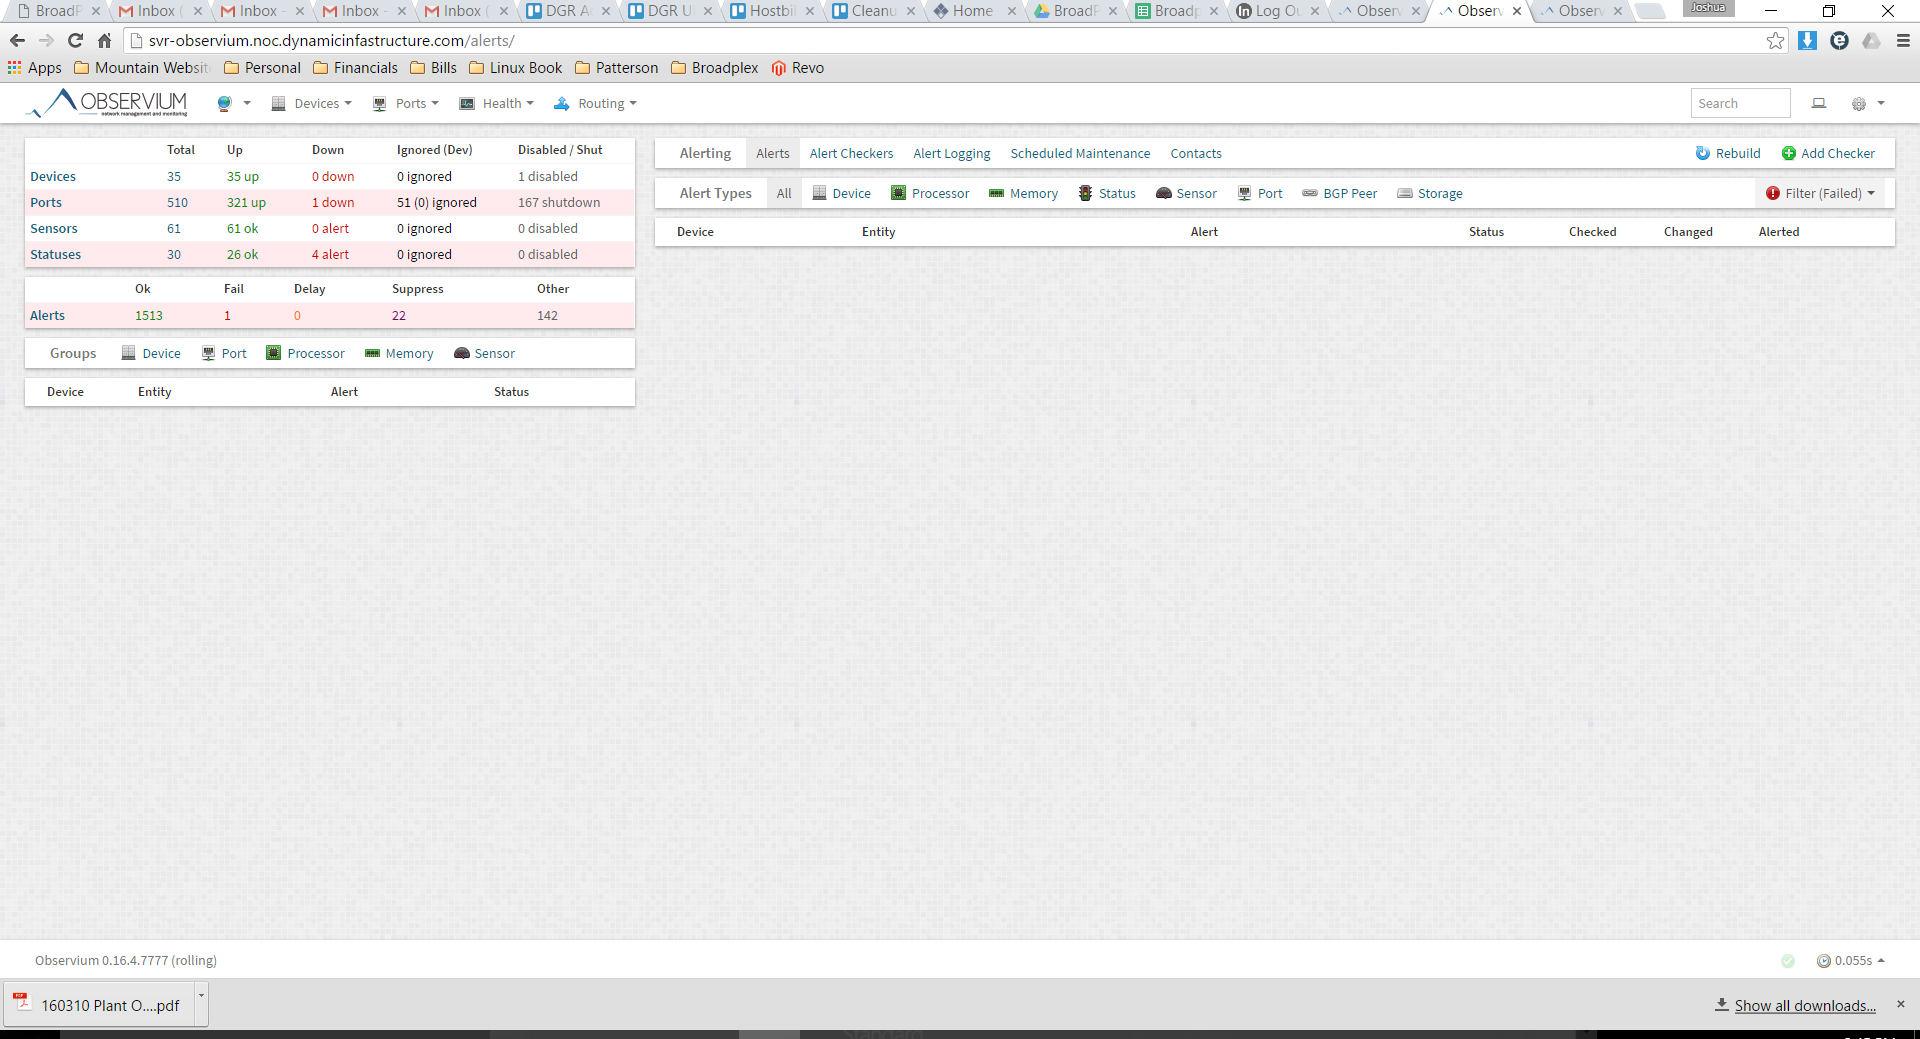
Ideally, I'd like it if there were nothing in red on the dashboard (as if there are issues).
[image: Inline image 1]
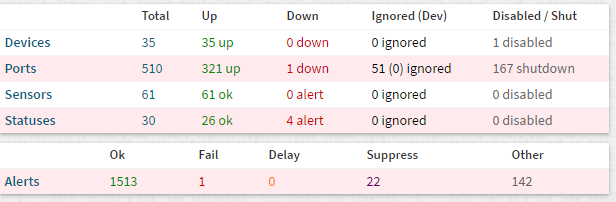
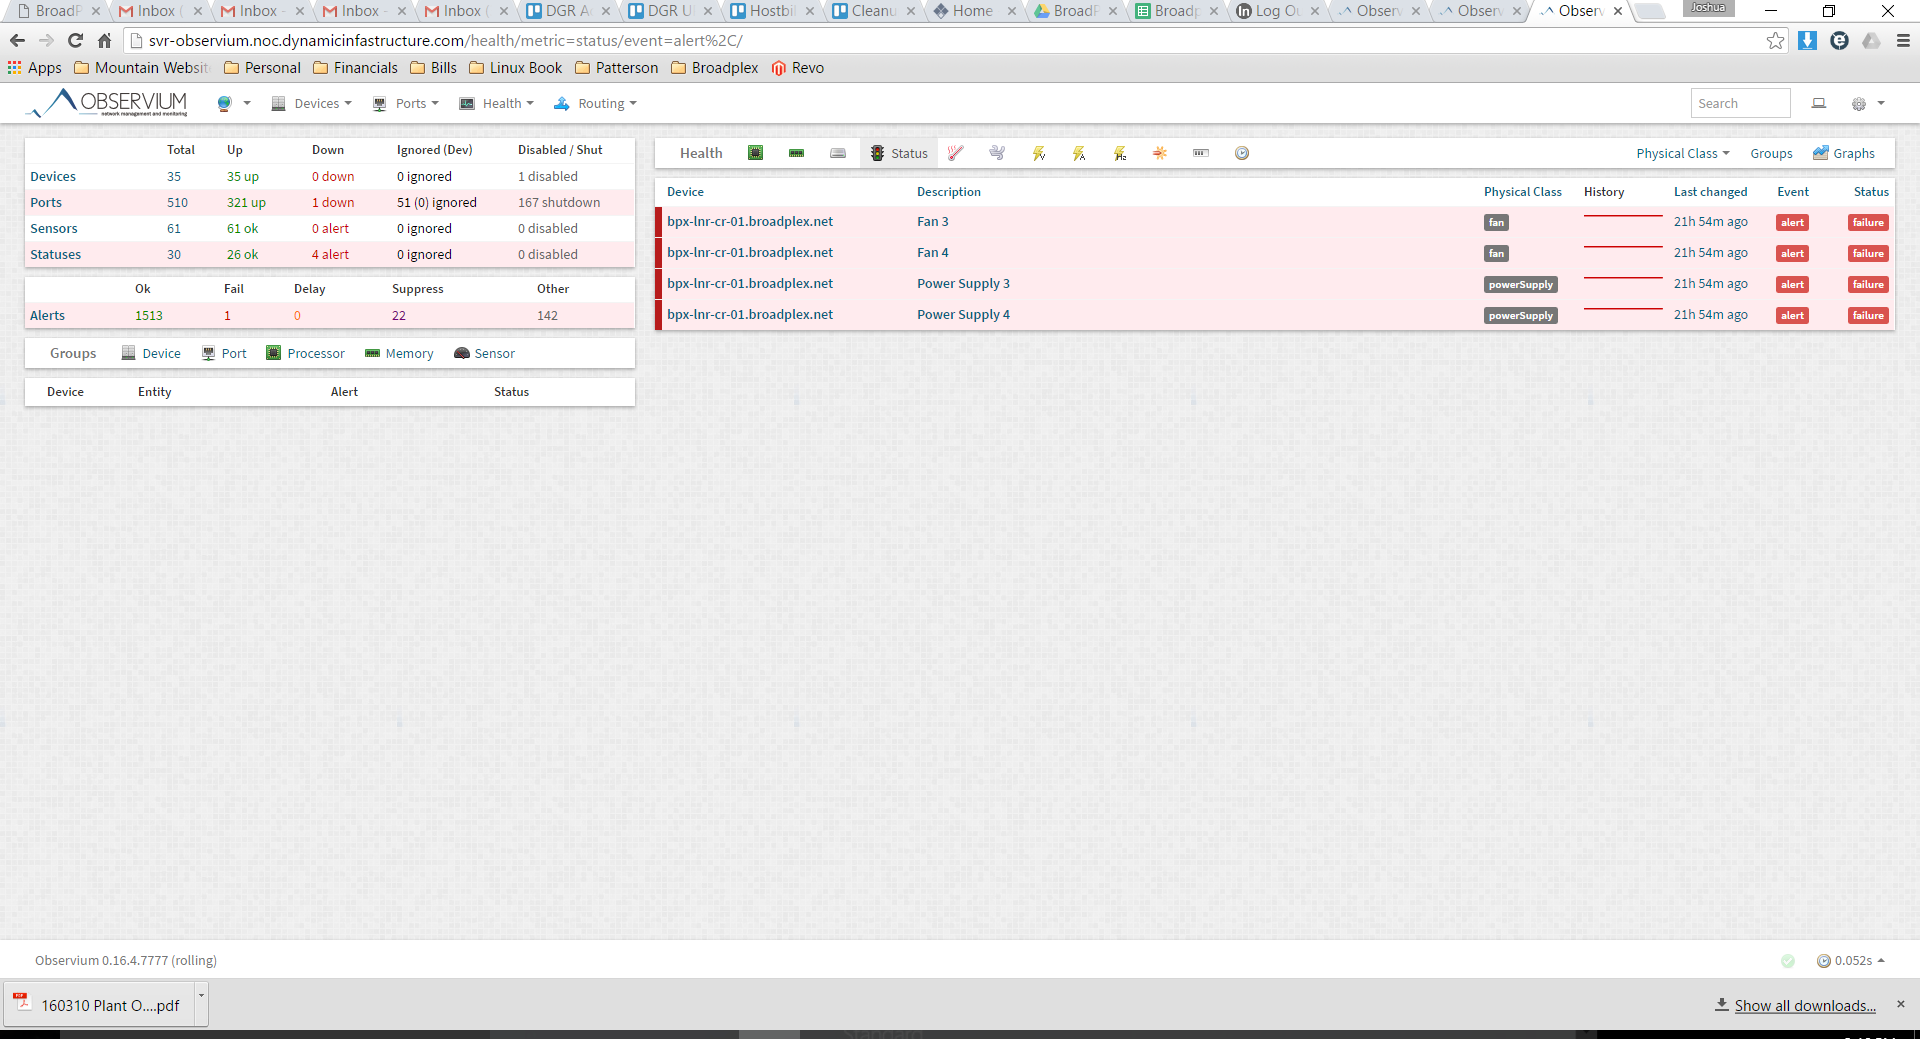
Observium says I have a port down and 1 alert failed. However, all alerts are either OK or suppressed. Ports are either on and in use or disabled.
There is nothing that shows in those lists. [image: Inline image 2] [image: Inline image 3]
Any reason why it says that something is down?
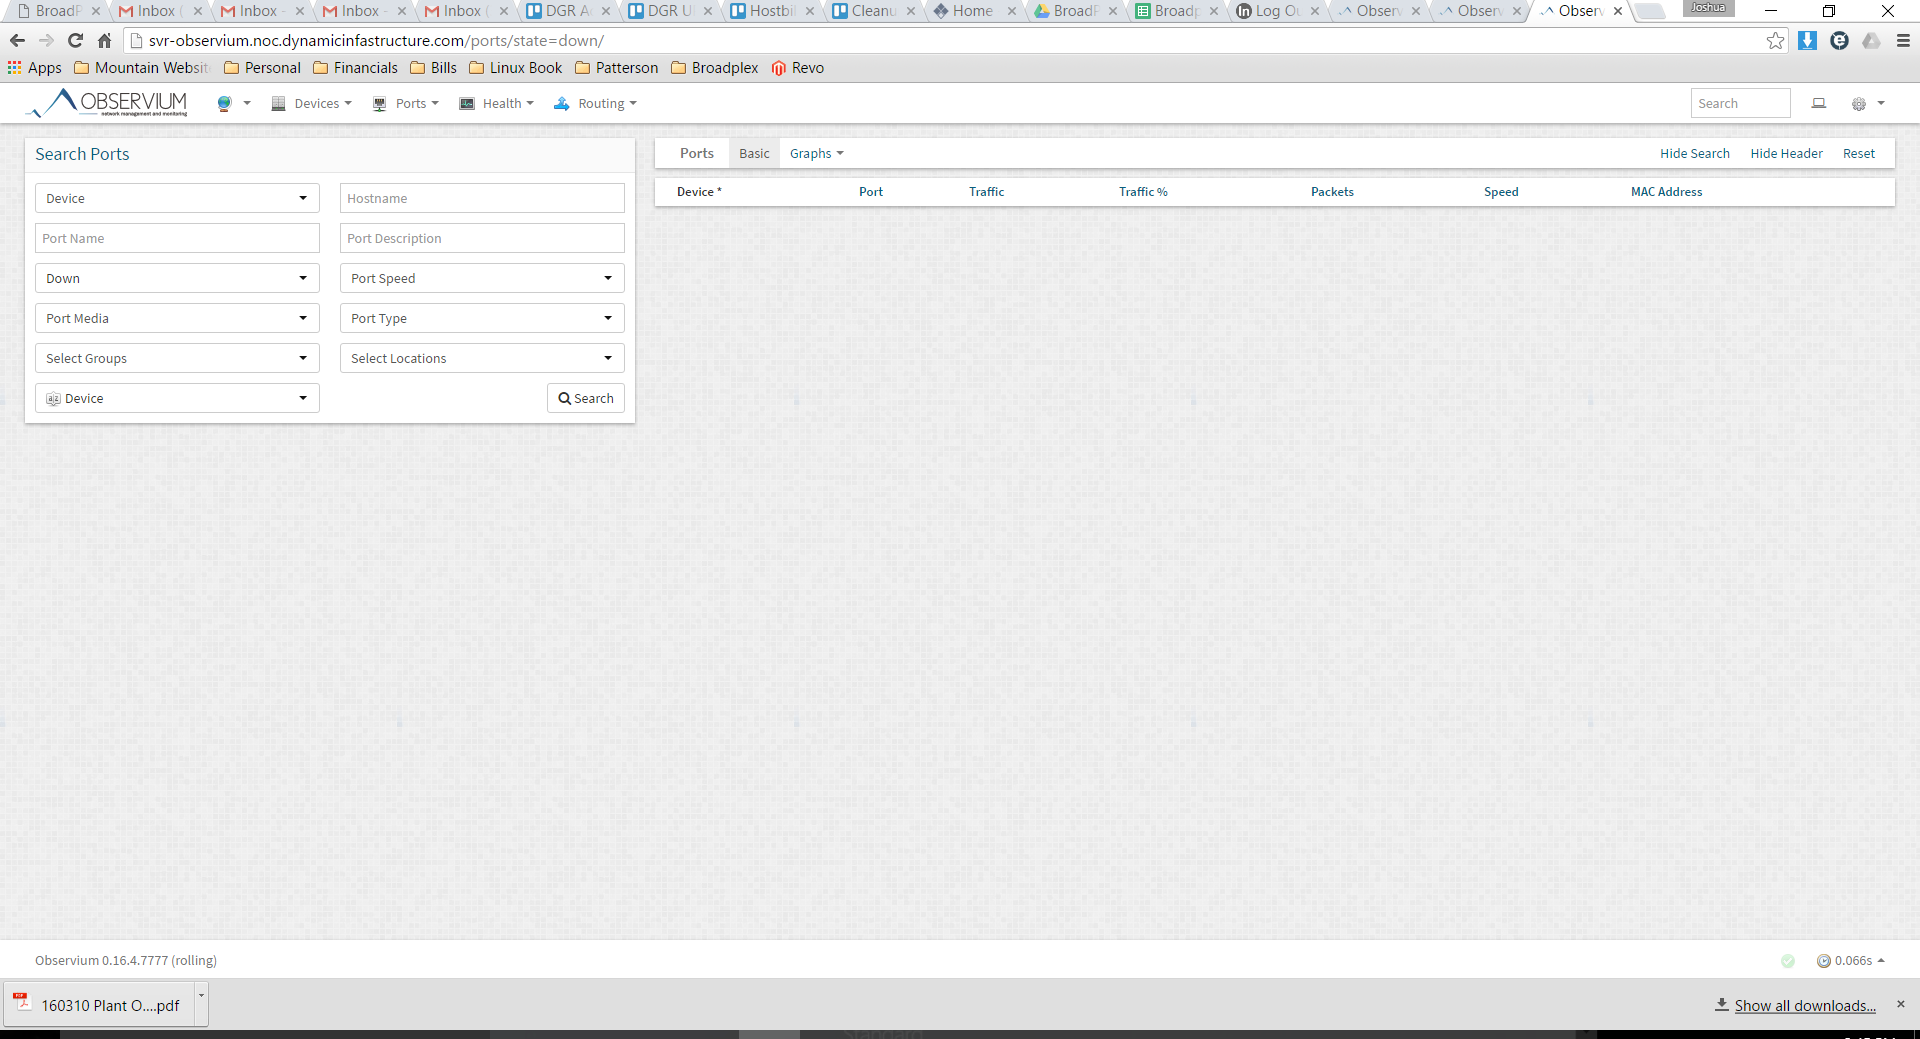
Also, I have a unit that does not have 2 out of 4 PSUs and fans. Show's that they are down. [image: Inline image 4]
I have suppressed the alerts. Is there a way to get it to ignore just what is currently down without ignoring the whole device?
Your help is appreciated. Thanks.
participants (1)
-
 Josh Hopper