permissions problem after update

Just finished an update that was a bit overdue (523 --> 540) and now I'm getting various errors while rendering RRD:
"Draw Error" "ERROR: can not parse an empty rpn expression" "RRDTool seems to have generated an empty graph. Please ensure that RRDs are being populated for this device."
While at the same time, some RRDs do render correctly.
On the dashboard the message is different:
"Permission error You have insufficient permissions to view this page"
The poller runs as user:group "observium:obervium" I have run "chown -R observium:observium /opt/observium" out of paranoia, but it didn't help.
What am I missing?
Thanks for your time.

I’m not really sure we’ve changed much that should affect this.
Which graphs specifically?
You’ll often need to shift-refresh after an svn up to clear cached javascript, but that shouldn’t affect the graph auth, because that’s just checking you’re allowed to view those devices/entities, which is immediately short-circuited if you’re a global-view or admin user anyways.
Adam.
On 11 Aug 2026, at 14:32, Eric Bates via observium observium@lists.observium.org wrote:
Just finished an update that was a bit overdue (523 --> 540) and now I'm getting various errors while rendering RRD:
"Draw Error" "ERROR: can not parse an empty rpn expression" "RRDTool seems to have generated an empty graph. Please ensure that RRDs are being populated for this device."
While at the same time, some RRDs do render correctly.
On the dashboard the message is different:
"Permission error You have insufficient permissions to view this page"
The poller runs as user:group "observium:obervium" I have run "chown -R observium:observium /opt/observium" out of paranoia, but it didn't help.
What am I missing?
Thanks for your time.
-- MS #46 Clark 159a _______________________________________________ observium mailing list -- observium@lists.observium.org To unsubscribe send an email to observium-leave@lists.observium.org
After studying some more, the device RRD errors are only appearing on a few of the devices and they all have snmp errors (not an Observium problem); so lets forget about that report (they did use to just render blank).
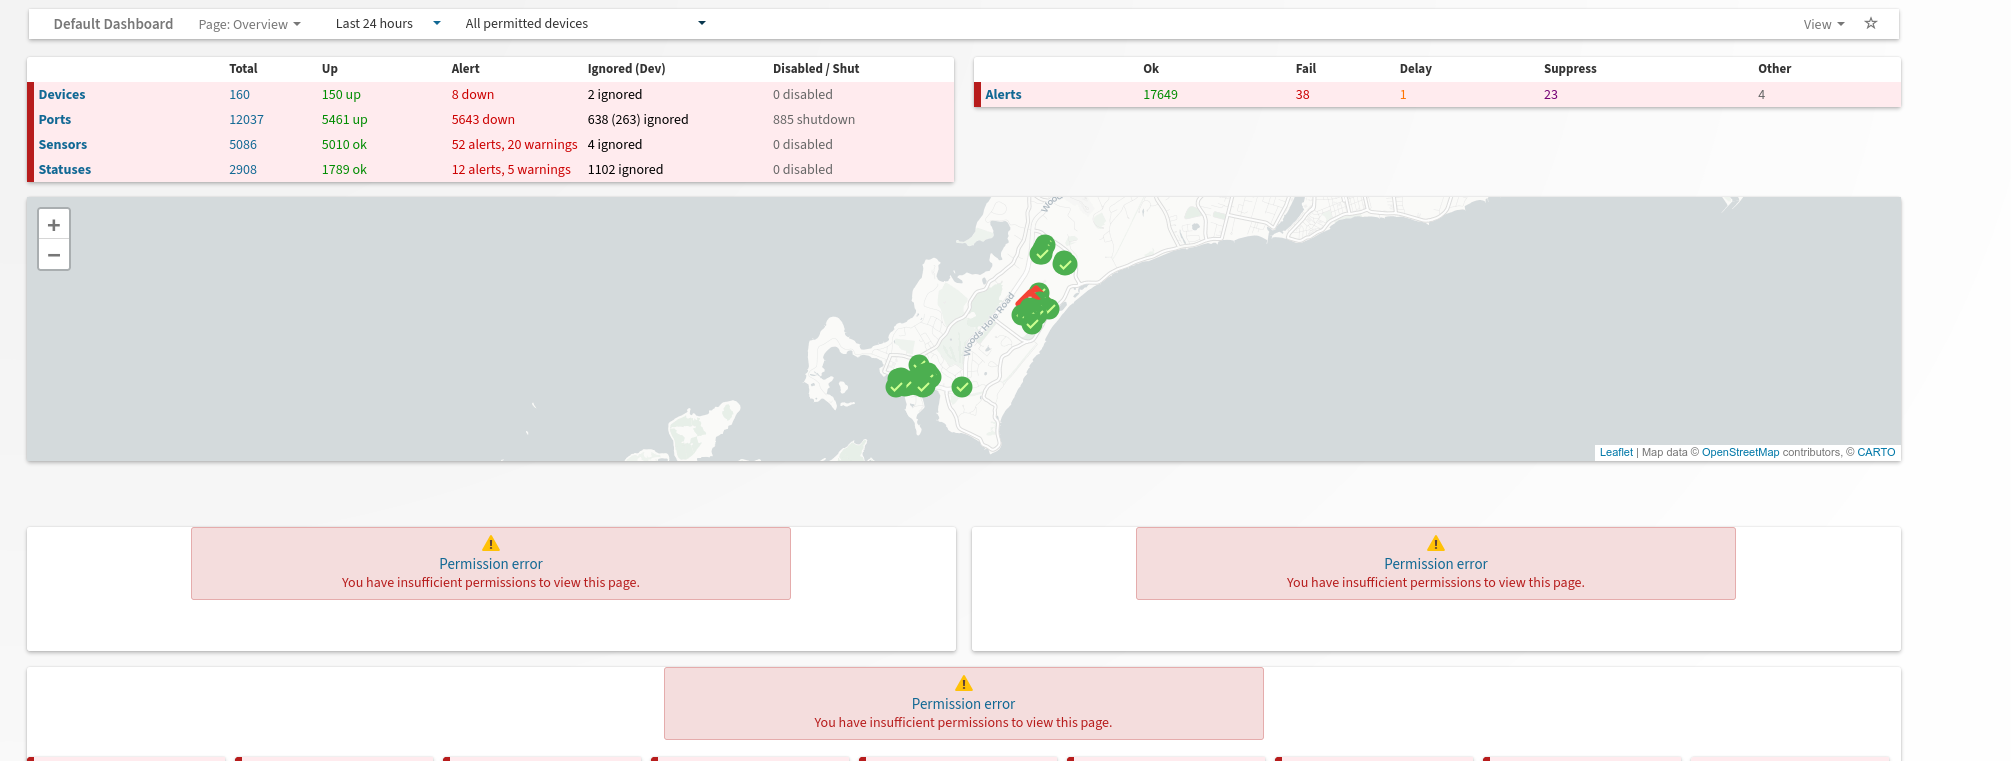
However, on the default dashboard is refusing to render graphs:
[cid:part1.Z8M9uKkp.PrLMTxPU@whoi.edu]
I don't honestly remember what renders in these 3 blocks; but one of them is the aggregate throuput gathered from all the ifdesc labeled with "Transit".
On 8/11/26 09:41, Adam Armstrong wrote:
This email originated outside of WHOI. Please use caution if clicking on links or opening attachments.
I’m not really sure we’ve changed much that should affect this.
Which graphs specifically?
You’ll often need to shift-refresh after an svn up to clear cached javascript, but that shouldn’t affect the graph auth, because that’s just checking you’re allowed to view those devices/entities, which is immediately short-circuited if you’re a global-view or admin user anyways.
Adam.
On 11 Aug 2026, at 14:32, Eric Bates via observium observium@lists.observium.orgmailto:observium@lists.observium.org wrote:
Just finished an update that was a bit overdue (523 --> 540) and now I'm getting various errors while rendering RRD:
"Draw Error" "ERROR: can not parse an empty rpn expression" "RRDTool seems to have generated an empty graph. Please ensure that RRDs are being populated for this device."
While at the same time, some RRDs do render correctly.
On the dashboard the message is different:
"Permission error You have insufficient permissions to view this page"
The poller runs as user:group "observium:obervium" I have run "chown -R observium:observium /opt/observium" out of paranoia, but it didn't help.
What am I missing?
Thanks for your time.
-- MS #46 Clark 159a _______________________________________________ observium mailing list -- observium@lists.observium.orgmailto:observium@lists.observium.org To unsubscribe send an email to observium-leave@lists.observium.orgmailto:observium-leave@lists.observium.org
-- MS #46 Clark 159a
Does that graph work if you recreate it as a new widget?
Adam,
On 11 Aug 2026, at 14:59, Eric Bates ebates@whoi.edu wrote:
After studying some more, the device RRD errors are only appearing on a few of the devices and they all have snmp errors (not an Observium problem); so lets forget about that report (they did use to just render blank).
However, on the default dashboard is refusing to render graphs:
<KNqki6pBVb0fr7PB.png>
I don't honestly remember what renders in these 3 blocks; but one of them is the aggregate throuput gathered from all the ifdesc labeled with "Transit".
On 8/11/26 09:41, Adam Armstrong wrote:
This email originated outside of WHOI. Please use caution if clicking on links or opening attachments.
I’m not really sure we’ve changed much that should affect this.
Which graphs specifically?
You’ll often need to shift-refresh after an svn up to clear cached javascript, but that shouldn’t affect the graph auth, because that’s just checking you’re allowed to view those devices/entities, which is immediately short-circuited if you’re a global-view or admin user anyways.
Adam.
On 11 Aug 2026, at 14:32, Eric Bates via observium observium@lists.observium.org mailto:observium@lists.observium.org wrote:
Just finished an update that was a bit overdue (523 --> 540) and now I'm getting various errors while rendering RRD:
"Draw Error" "ERROR: can not parse an empty rpn expression" "RRDTool seems to have generated an empty graph. Please ensure that RRDs are being populated for this device."
While at the same time, some RRDs do render correctly.
On the dashboard the message is different:
"Permission error You have insufficient permissions to view this page"
The poller runs as user:group "observium:obervium" I have run "chown -R observium:observium /opt/observium" out of paranoia, but it didn't help.
What am I missing?
Thanks for your time.
-- MS #46 Clark 159a _______________________________________________ observium mailing list -- observium@lists.observium.org mailto:observium@lists.observium.org To unsubscribe send an email to observium-leave@lists.observium.org mailto:observium-leave@lists.observium.org
-- MS #46 Clark 159a
I was trying to do that; but I cannot find the correct widget? Turns out all three broken graphs are rendering the aggregate traffic (those interfaces with "Transit" in their description) just the scale varies: "one day", "one week", and "one month"
When I go to "Add widget", in the traffic section, I only see "Top N" and "Traffic Composition". Not sure what it ought to be called, but there is nothing like "total throughput" or "aggregate graph"; so I can't add yet another example to see what happens.
I deleted one of the 3 broken RRD thinking that maybe it would then reappear in the "add widget" box; but that is not the case.
So I added a traffic comparison widget. And it's also refusing to render with the message "No Auth"
On 8/11/26 10:30, Adam Armstrong wrote: This email originated outside of WHOI. Please use caution if clicking on links or opening attachments. Does that graph work if you recreate it as a new widget?
Adam,
On 11 Aug 2026, at 14:59, Eric Bates ebates@whoi.edumailto:ebates@whoi.edu wrote:
After studying some more, the device RRD errors are only appearing on a few of the devices and they all have snmp errors (not an Observium problem); so lets forget about that report (they did use to just render blank).
However, on the default dashboard is refusing to render graphs:
<KNqki6pBVb0fr7PB.png>
I don't honestly remember what renders in these 3 blocks; but one of them is the aggregate throuput gathered from all the ifdesc labeled with "Transit".
On 8/11/26 09:41, Adam Armstrong wrote:
This email originated outside of WHOI. Please use caution if clicking on links or opening attachments.
I’m not really sure we’ve changed much that should affect this.
Which graphs specifically?
You’ll often need to shift-refresh after an svn up to clear cached javascript, but that shouldn’t affect the graph auth, because that’s just checking you’re allowed to view those devices/entities, which is immediately short-circuited if you’re a global-view or admin user anyways.
Adam.
On 11 Aug 2026, at 14:32, Eric Bates via observium observium@lists.observium.orgmailto:observium@lists.observium.org wrote:
Just finished an update that was a bit overdue (523 --> 540) and now I'm getting various errors while rendering RRD:
"Draw Error" "ERROR: can not parse an empty rpn expression" "RRDTool seems to have generated an empty graph. Please ensure that RRDs are being populated for this device."
While at the same time, some RRDs do render correctly.
On the dashboard the message is different:
"Permission error You have insufficient permissions to view this page"
The poller runs as user:group "observium:obervium" I have run "chown -R observium:observium /opt/observium" out of paranoia, but it didn't help.
What am I missing?
Thanks for your time.
-- MS #46 Clark 159a _______________________________________________ observium mailing list -- observium@lists.observium.orgmailto:observium@lists.observium.org To unsubscribe send an email to observium-leave@lists.observium.orgmailto:observium-leave@lists.observium.org
-- MS #46 Clark 159a
-- MS #46 Clark 159a
That makes sense. And while I probably did this once a long time ago I have no idea where to find the graph of the aggregated traffic to try and add it to a dashboard?
I think I originally did this with ye olde "front page" and I have never touched it since the introduction of dashboards? I don't remember ever "adding" such a graph; so I have no idea where to find the original.
On 8/11/26 12:59, Adam Armstrong via observium wrote: This email originated outside of WHOI. Please use caution if clicking on links or opening attachments. It might be related to them being aggregates, but you add graph widgets from the graph page, because it’d be far too messy to have something that understood all of the entity and graph types inside the widget config 😅
Sent from my iPhone
On 11 Aug 2026, at 15:56, Eric Bates via observium observium@lists.observium.orgmailto:observium@lists.observium.org wrote:
I was trying to do that; but I cannot find the correct widget? Turns out all three broken graphs are rendering the aggregate traffic (those interfaces with "Transit" in their description) just the scale varies: "one day", "one week", and "one month"
When I go to "Add widget", in the traffic section, I only see "Top N" and "Traffic Composition". Not sure what it ought to be called, but there is nothing like "total throughput" or "aggregate graph"; so I can't add yet another example to see what happens.
I deleted one of the 3 broken RRD thinking that maybe it would then reappear in the "add widget" box; but that is not the case.
So I added a traffic comparison widget. And it's also refusing to render with the message "No Auth"
On 8/11/26 10:30, Adam Armstrong wrote: This email originated outside of WHOI. Please use caution if clicking on links or opening attachments. Does that graph work if you recreate it as a new widget?
Adam,
On 11 Aug 2026, at 14:59, Eric Bates ebates@whoi.edumailto:ebates@whoi.edu wrote:
After studying some more, the device RRD errors are only appearing on a few of the devices and they all have snmp errors (not an Observium problem); so lets forget about that report (they did use to just render blank).
However, on the default dashboard is refusing to render graphs:
<KNqki6pBVb0fr7PB.png>
I don't honestly remember what renders in these 3 blocks; but one of them is the aggregate throuput gathered from all the ifdesc labeled with "Transit".
On 8/11/26 09:41, Adam Armstrong wrote:
This email originated outside of WHOI. Please use caution if clicking on links or opening attachments.
I’m not really sure we’ve changed much that should affect this.
Which graphs specifically?
You’ll often need to shift-refresh after an svn up to clear cached javascript, but that shouldn’t affect the graph auth, because that’s just checking you’re allowed to view those devices/entities, which is immediately short-circuited if you’re a global-view or admin user anyways.
Adam.
On 11 Aug 2026, at 14:32, Eric Bates via observium observium@lists.observium.orgmailto:observium@lists.observium.org wrote:
Just finished an update that was a bit overdue (523 --> 540) and now I'm getting various errors while rendering RRD:
"Draw Error" "ERROR: can not parse an empty rpn expression" "RRDTool seems to have generated an empty graph. Please ensure that RRDs are being populated for this device."
While at the same time, some RRDs do render correctly.
On the dashboard the message is different:
"Permission error You have insufficient permissions to view this page"
The poller runs as user:group "observium:obervium" I have run "chown -R observium:observium /opt/observium" out of paranoia, but it didn't help.
What am I missing?
Thanks for your time.
-- MS #46 Clark 159a _______________________________________________ observium mailing list -- observium@lists.observium.orgmailto:observium@lists.observium.org To unsubscribe send an email to observium-leave@lists.observium.orgmailto:observium-leave@lists.observium.org
-- MS #46 Clark 159a
-- MS #46 Clark 159a
_______________________________________________ observium mailing list -- observium@lists.observium.orgmailto:observium@lists.observium.org To unsubscribe send an email to observium-leave@lists.observium.orgmailto:observium-leave@lists.observium.org
_______________________________________________ observium mailing list -- observium@lists.observium.orgmailto:observium@lists.observium.org To unsubscribe send an email to observium-leave@lists.observium.orgmailto:observium-leave@lists.observium.org
-- MS #46 Clark 159a
Yah, that worked.
I have replicated the old "Transit:" ifAlias tag by searching for "Transit:" in the port description, created an aggregate graph and added it to the default dashboard and it displays fine.
Is the old automatic "Transit:" widget gone now?
Still problematic: the "traffic comparison" widget just says: "No Auth"
On 8/11/26 19:02, Adam Armstrong wrote: This email originated outside of WHOI. Please use caution if clicking on links or opening attachments. Easiest way is probably to make a group that matches the ports you want, get it to generate a group aggregate graph, then from the graph browser add that graph to the required dashboard.
I should probably add an aggregate graph building UI at least for ports.
Adam.
Sent from my iPhone
On 11 Aug 2026, at 19:21, Eric Bates via observium observium@lists.observium.orgmailto:observium@lists.observium.org wrote:
That makes sense. And while I probably did this once a long time ago I have no idea where to find the graph of the aggregated traffic to try and add it to a dashboard?
I think I originally did this with ye olde "front page" and I have never touched it since the introduction of dashboards? I don't remember ever "adding" such a graph; so I have no idea where to find the original.
On 8/11/26 12:59, Adam Armstrong via observium wrote: This email originated outside of WHOI. Please use caution if clicking on links or opening attachments. It might be related to them being aggregates, but you add graph widgets from the graph page, because it’d be far too messy to have something that understood all of the entity and graph types inside the widget config 😅
Sent from my iPhone
On 11 Aug 2026, at 15:56, Eric Bates via observium observium@lists.observium.orgmailto:observium@lists.observium.org wrote:
I was trying to do that; but I cannot find the correct widget? Turns out all three broken graphs are rendering the aggregate traffic (those interfaces with "Transit" in their description) just the scale varies: "one day", "one week", and "one month"
When I go to "Add widget", in the traffic section, I only see "Top N" and "Traffic Composition". Not sure what it ought to be called, but there is nothing like "total throughput" or "aggregate graph"; so I can't add yet another example to see what happens.
I deleted one of the 3 broken RRD thinking that maybe it would then reappear in the "add widget" box; but that is not the case.
So I added a traffic comparison widget. And it's also refusing to render with the message "No Auth"
On 8/11/26 10:30, Adam Armstrong wrote: This email originated outside of WHOI. Please use caution if clicking on links or opening attachments. Does that graph work if you recreate it as a new widget?
Adam,
On 11 Aug 2026, at 14:59, Eric Bates ebates@whoi.edumailto:ebates@whoi.edu wrote:
After studying some more, the device RRD errors are only appearing on a few of the devices and they all have snmp errors (not an Observium problem); so lets forget about that report (they did use to just render blank).
However, on the default dashboard is refusing to render graphs:
<KNqki6pBVb0fr7PB.png>
I don't honestly remember what renders in these 3 blocks; but one of them is the aggregate throuput gathered from all the ifdesc labeled with "Transit".
On 8/11/26 09:41, Adam Armstrong wrote:
This email originated outside of WHOI. Please use caution if clicking on links or opening attachments.
I’m not really sure we’ve changed much that should affect this.
Which graphs specifically?
You’ll often need to shift-refresh after an svn up to clear cached javascript, but that shouldn’t affect the graph auth, because that’s just checking you’re allowed to view those devices/entities, which is immediately short-circuited if you’re a global-view or admin user anyways.
Adam.
On 11 Aug 2026, at 14:32, Eric Bates via observium observium@lists.observium.orgmailto:observium@lists.observium.org wrote:
Just finished an update that was a bit overdue (523 --> 540) and now I'm getting various errors while rendering RRD:
"Draw Error" "ERROR: can not parse an empty rpn expression" "RRDTool seems to have generated an empty graph. Please ensure that RRDs are being populated for this device."
While at the same time, some RRDs do render correctly.
On the dashboard the message is different:
"Permission error You have insufficient permissions to view this page"
The poller runs as user:group "observium:obervium" I have run "chown -R observium:observium /opt/observium" out of paranoia, but it didn't help.
What am I missing?
Thanks for your time.
-- MS #46 Clark 159a _______________________________________________ observium mailing list -- observium@lists.observium.orgmailto:observium@lists.observium.org To unsubscribe send an email to observium-leave@lists.observium.orgmailto:observium-leave@lists.observium.org
-- MS #46 Clark 159a
-- MS #46 Clark 159a
_______________________________________________ observium mailing list -- observium@lists.observium.orgmailto:observium@lists.observium.org To unsubscribe send an email to observium-leave@lists.observium.orgmailto:observium-leave@lists.observium.org
_______________________________________________ observium mailing list -- observium@lists.observium.orgmailto:observium@lists.observium.org To unsubscribe send an email to observium-leave@lists.observium.orgmailto:observium-leave@lists.observium.org
-- MS #46 Clark 159a
_______________________________________________ observium mailing list -- observium@lists.observium.orgmailto:observium@lists.observium.org To unsubscribe send an email to observium-leave@lists.observium.orgmailto:observium-leave@lists.observium.org
-- MS #46 Clark 159a
participants (2)
-
 Adam Armstrong
 -
 Eric Bates