Graph Gaps - aka I've horked something

Hi all,
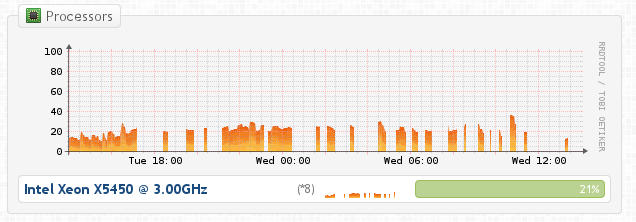
Yesterday afternoon I added several devices and since then I'm getting gaps in *all* my graphs. Even those for the localhost. I upgraded to the latest (commercial) version, just to check, and still having issues. I'm not quite sure what to make of this.
I have nfsen and cacti running on the same box and their graphs all look ok so it seems something specific to observium. My disk io is a bit high but not too bad, cpu is good, ram is fine. See attached screen shot for example of gaps.
8gb of RAM Ubuntu 12.04 750gb sata disk (ST3750640NS) Intel(R) Xeon(R) CPU X5450 @ 3.00GHz
*couple of notes*
- a few days ago I tweaked some mysql settings < #table_cache = 64 ---
table_cache = 600
65c65 < query_cache_size = 16M ---
query_cache_size = 32M
- Also in order to group some devices together I manually edited the observium.device.location column in the db for some of the devices.
Thoughts? Direction?
Thanks all!
--chip

The fact that you get any data at all suggests that it's not a code issue.
The graph looks exactly how i'd expect for something where the snmp queries are imtermittently failing, either because of poor network or something like a firewall with constrained sessions.
Have you tried running the poller in debug mode and seeing what output you get?
adam.
On 2013-11-06 19:12, chip wrote:
Hi all,
Yesterday afternoon I added several devices and since then I'm getting gaps in *all* my graphs. Even those for the localhost. I upgraded to the latest (commercial) version, just to check, and still having issues. I'm not quite sure what to make of this.
I have nfsen and cacti running on the same box and their graphs all look ok so it seems something specific to observium. My disk io is a bit high but not too bad, cpu is good, ram is fine. See attached screen shot for example of gaps.
8gb of RAM Ubuntu 12.04 750gb sata disk (ST3750640NS) Intel(R) Xeon(R) CPU X5450 @ 3.00GHz
*couple of notes*
- a few days ago I tweaked some mysql settings
< #table_cache = 64
table_cache = 600 65c65
< query_cache_size = 16M
query_cache_size = 32M
- Also in order to group some devices together I manually edited the
observium.device.location column in the db for some of the devices.
Thoughts? Direction?
Thanks all!
--chip
-- Just my $.02, your mileage may vary, batteries not included, etc.... _______________________________________________ observium mailing list observium@observium.org http://postman.memetic.org/cgi-bin/mailman/listinfo/observium
That's what I thought at first as well, then noticed the issue happening with monitoring the localhost, including the ping response time. Looking at all the graphs, the gaps seem consistent across everything so it's like everything works or everything doesn't. I would assume that something intermittent would allow some hosts or oids to work and some do not. Very odd. My sysadmin skills aren't great but I'll keep poking.
Attached is the log for running sudo ./poller.php -d -h localhost | tee ~/log4.txt
Thanks for all the effort!
--chip
On Wed, Nov 6, 2013 at 2:29 PM, Adam Armstrong adama@memetic.org wrote:
The fact that you get any data at all suggests that it's not a code issue.
The graph looks exactly how i'd expect for something where the snmp queries are imtermittently failing, either because of poor network or something like a firewall with constrained sessions.
Have you tried running the poller in debug mode and seeing what output you get?
adam.
On 2013-11-06 19:12, chip wrote:
Hi all,
Yesterday afternoon I added several devices and since then I'm getting gaps in *all* my graphs. Even those for the localhost. I upgraded to the latest (commercial) version, just to check, and still having issues. I'm not quite sure what to make of this.
I have nfsen and cacti running on the same box and their graphs all look ok so it seems something specific to observium. My disk io is a bit high but not too bad, cpu is good, ram is fine. See attached screen shot for example of gaps.
8gb of RAM Ubuntu 12.04 750gb sata disk (ST3750640NS) Intel(R) Xeon(R) CPU X5450 @ 3.00GHz
*couple of notes*
- a few days ago I tweaked some mysql settings
< #table_cache = 64
table_cache = 600 65c65
< query_cache_size = 16M
query_cache_size = 32M
- Also in order to group some devices together I manually edited the
observium.device.location column in the db for some of the devices.
Thoughts? Direction?
Thanks all!
--chip
-- Just my $.02, your mileage may vary, batteries not included, etc.... _______________________________________________ observium mailing list observium@observium.org http://postman.memetic.org/cgi-bin/mailman/listinfo/observium
observium mailing list observium@observium.org http://postman.memetic.org/cgi-bin/mailman/listinfo/observium
The ping graph for localhost?
That is very odd. The ping graph doesn't even use snmp.
Are you using the poller wrapper or not?
adam.
On 2013-11-06 19:53, chip wrote:
That's what I thought at first as well, then noticed the issue happening with monitoring the localhost, including the ping response time. Looking at all the graphs, the gaps seem consistent across everything so it's like everything works or everything doesn't. I would assume that something intermittent would allow some hosts or oids to work and some do not. Very odd. My sysadmin skills aren't great but I'll keep poking.
Attached is the log for running sudo ./poller.php -d -h localhost | tee ~/log4.txt
Thanks for all the effort!
--chip
On Wed, Nov 6, 2013 at 2:29 PM, Adam Armstrong adama@memetic.org wrote:
The fact that you get any data at all suggests that it's not a code issue.
The graph looks exactly how i'd expect for something where the snmp queries are imtermittently failing, either because of poor network or something like a firewall with constrained sessions.
Have you tried running the poller in debug mode and seeing what output you get?
adam.
On 2013-11-06 19:12, chip wrote:
Hi all,
Yesterday afternoon I added several devices and since then I'm getting gaps in *all* my graphs. Even those for the localhost. I upgraded to the latest (commercial) version, just to check, and still having issues. I'm not quite sure what to make of this.
I have nfsen and cacti running on the same box and their graphs all look ok so it seems something specific to observium. My disk io is a bit high but not too bad, cpu is good, ram is fine. See attached screen shot for example of gaps.
8gb of RAM Ubuntu 12.04 750gb sata disk (ST3750640NS) Intel(R) Xeon(R) CPU X5450 @ 3.00GHz
*couple of notes*
- a few days ago I tweaked some mysql settings
< #table_cache = 64
table_cache = 600 65c65
< query_cache_size = 16M
query_cache_size = 32M
- Also in order to group some devices together I manually edited the
observium.device.location column in the db for some of the devices.
Thoughts? Direction?
Thanks all!
--chip
-- Just my $.02, your mileage may vary, batteries not included, etc.... _______________________________________________ observium mailing list observium@observium.org http://postman.memetic.org/cgi-bin/mailman/listinfo/observium [1] _______________________________________________ observium mailing list observium@observium.org http://postman.memetic.org/cgi-bin/mailman/listinfo/observium [1]
-- Just my $.02, your mileage may vary, batteries not included, etc....
Links:
[1] http://postman.memetic.org/cgi-bin/mailman/listinfo/observium
observium mailing list observium@observium.org http://postman.memetic.org/cgi-bin/mailman/listinfo/observium
Yeah.
[15:17:25]--> cat /etc/cron.d/observium 33 */6 * * * root /data/observium/discovery.php -h all >> /dev/null 2>&1 */5 * * * * root /data/observium/discovery.php -h new >> /dev/null 2>&1 */5 * * * * root /data/observium/poller-wrapper.py 1 >> /dev/null 2>&1
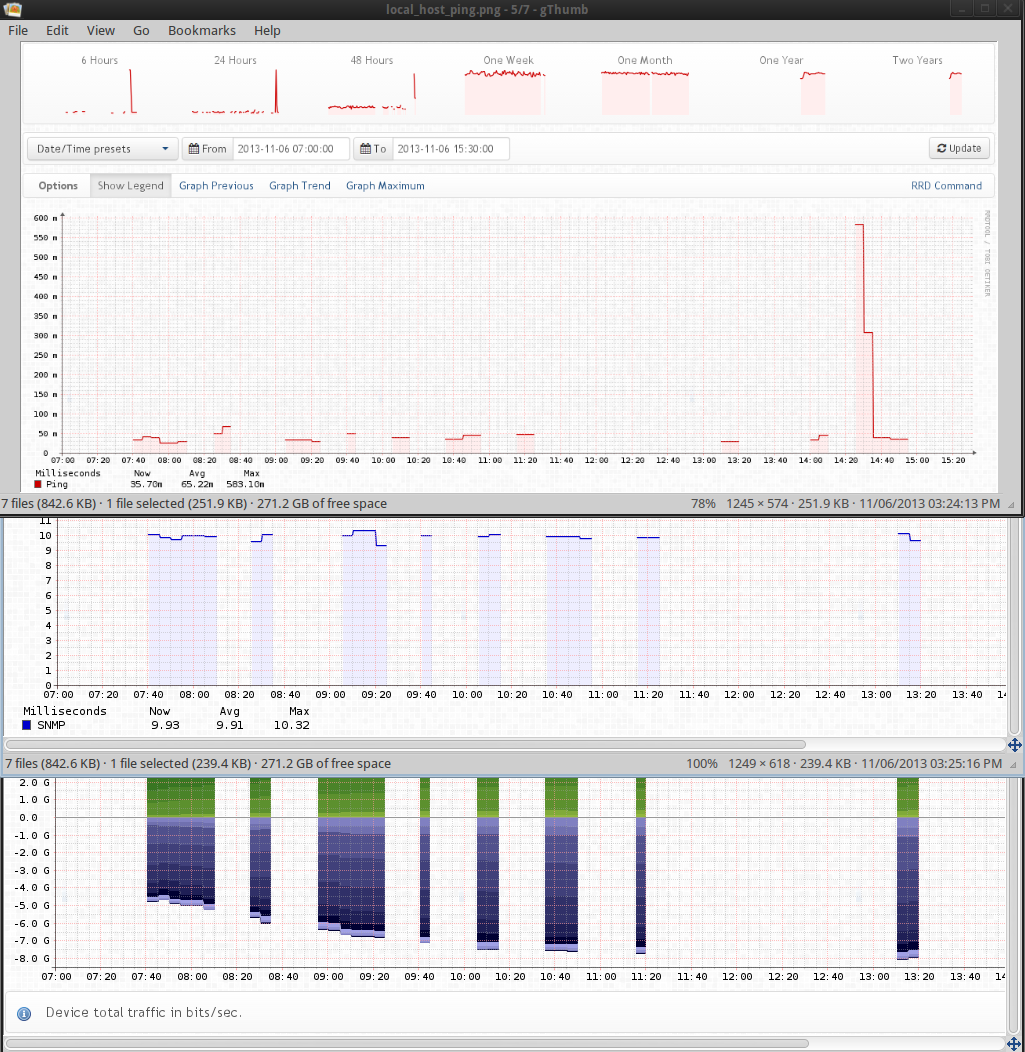
Perhaps I accidentally horked something when updating the location in the database directly. My only edit was updating the location field of some devices. This is just a test box so if I lose everything, no big deal. Does the poller collect all data then commit to the db and rrd at once, doesn't look like it though.
See attached screen shot comparing the ping and snmp_ping of localhost and then the aggregate traffic graph of a host sitting 80ms away. I may just trash it all and start over, see what happens.
--chip
On Wed, Nov 6, 2013 at 3:15 PM, Adam Armstrong adama@memetic.org wrote:
The ping graph for localhost?
That is very odd. The ping graph doesn't even use snmp.
Are you using the poller wrapper or not?
adam.
On 2013-11-06 19:53, chip wrote:
That's what I thought at first as well, then noticed the issue happening with monitoring the localhost, including the ping response time. Looking at all the graphs, the gaps seem consistent across everything so it's like everything works or everything doesn't. I would assume that something intermittent would allow some hosts or oids to work and some do not. Very odd. My sysadmin skills aren't great but I'll keep poking.
Attached is the log for running sudo ./poller.php -d -h localhost | tee ~/log4.txt
Thanks for all the effort!
--chip
On Wed, Nov 6, 2013 at 2:29 PM, Adam Armstrong adama@memetic.org wrote:
The fact that you get any data at all suggests that it's not a code issue.
The graph looks exactly how i'd expect for something where the snmp queries are imtermittently failing, either because of poor network or something like a firewall with constrained sessions.
Have you tried running the poller in debug mode and seeing what output you get?
adam.
On 2013-11-06 19:12, chip wrote:
Hi all,
Yesterday afternoon I added several devices and since then I'm getting gaps in *all* my graphs. Even those for the localhost. I upgraded to the latest (commercial) version, just to check, and still having issues. I'm not quite sure what to make of this.
I have nfsen and cacti running on the same box and their graphs all look ok so it seems something specific to observium. My disk io is a bit high but not too bad, cpu is good, ram is fine. See attached screen shot for example of gaps.
8gb of RAM Ubuntu 12.04 750gb sata disk (ST3750640NS) Intel(R) Xeon(R) CPU X5450 @ 3.00GHz
*couple of notes*
- a few days ago I tweaked some mysql settings
< #table_cache = 64
table_cache = 600 65c65
< query_cache_size = 16M
query_cache_size = 32M
- Also in order to group some devices together I manually edited the
observium.device.location column in the db for some of the devices.
Thoughts? Direction?
Thanks all!
--chip
-- Just my $.02, your mileage may vary, batteries not included, etc.... _______________________________________________ observium mailing list observium@observium.org http://postman.memetic.org/cgi-bin/mailman/listinfo/observium [1]
observium mailing list observium@observium.org http://postman.memetic.org/cgi-bin/mailman/listinfo/observium [1]
-- Just my $.02, your mileage may vary, batteries not included, etc....
Links:
[1] http://postman.memetic.org/cgi-bin/mailman/listinfo/observium
observium mailing list observium@observium.org http://postman.memetic.org/cgi-bin/mailman/listinfo/observium
observium mailing list observium@observium.org http://postman.memetic.org/cgi-bin/mailman/listinfo/observium
On 2013-11-06 20:34, chip wrote:
Yeah.
[15:17:25]--> cat /etc/cron.d/observium 33 */6 * * * root /data/observium/discovery.php -h all >> /dev/null 2>&1 */5 * * * * root /data/observium/discovery.php -h new >> /dev/null 2>&1 */5 * * * * root /data/observium/poller-wrapper.py 1 >> /dev/null 2>&1
Perhaps I accidentally horked something when updating the location in the database directly. My only edit was updating the location field of some devices. This is just a test box so if I lose everything, no big deal. Does the poller collect all data then commit to the db and rrd at once, doesn't look like it though.
See attached screen shot comparing the ping and snmp_ping of localhost and then the aggregate traffic graph of a host sitting 80ms away. I may just trash it all and start over, see what happens.
You realise you're only running one poller process, right?
adam.
participants (2)
-
 Adam Armstrong
 -
 chip
chip