
Hello, I have been a user of Observium for quite some time and currently paid subscriber, I have always wanted to see interactive graphs to improve usability. What I am asking for specifically is the ability to:
1. Hover the mouse cursor over the graph and have it show pop-up boxes with info that show the current value for that vertex on the graph. 2. The ability to select a time window by clicking and dragging the cursor across the graph.
This functionality is commonly seen on stock graphs such as finance.yahoo.com or finance.google.com where you can view values across the timeline and select time ranges by highlighting them on the graph with the mouse cursor.
Is this a feature that can be added to Observium? Also, if this is not the appropriate method to issue feature requests please kindly direct me towards the proper method.
Regards,
-=JGR

This isn't something that can be easily added because of how graphs are generated.
It's trivial with a graphing system that supports it and next to impossible with one that doesn't.
Since we use RRDtool as our metric storage system, we don't have efficient direct access to the data and rely on RRDtool itself to generate the images.
Adam.
Sent from BlueMail
On 19 Dec 2019, 23:36, at 23:36, Justin Radke via observium observium@observium.org wrote:
Hello, I have been a user of Observium for quite some time and currently paid subscriber, I have always wanted to see interactive graphs to improve usability. What I am asking for specifically is the ability to:
- Hover the mouse cursor over the graph and have it show pop-up boxes
with info that show the current value for that vertex on the graph. 2. The ability to select a time window by clicking and dragging the cursor across the graph.
This functionality is commonly seen on stock graphs such as finance.yahoo.com or finance.google.com where you can view values across the timeline and select time ranges by highlighting them on the graph with the mouse cursor.
Is this a feature that can be added to Observium? Also, if this is not the appropriate method to issue feature requests please kindly direct me towards the proper method.
Regards,
-=JGR
observium mailing list observium@observium.org http://postman.memetic.org/cgi-bin/mailman/listinfo/observium
Bummer, thanks for checking and for the response.
-=JGR
From: Adam Armstrong adama@memetic.org Sent: Thursday, December 19, 2019 3:41 PM To: Justin Radke via observium observium@observium.org Cc: Justin Radke justin.radke@directlink.coop Subject: Re: [Observium] Feature Request - Interactive Graphs
This isn't something that can be easily added because of how graphs are generated. It's trivial with a graphing system that supports it and next to impossible with one that doesn't. Since we use RRDtool as our metric storage system, we don't have efficient direct access to the data and rely on RRDtool itself to generate the images. Adam. Sent from BlueMailhttp://www.bluemail.me/r?b=15726 On 19 Dec 2019, at 23:36, Justin Radke via observium <observium@observium.orgmailto:observium@observium.org> wrote: Hello, I have been a user of Observium for quite some time and currently paid subscriber, I have always wanted to see interactive graphs to improve usability. What I am asking for specifically is the ability to:
1. Hover the mouse cursor over the graph and have it show pop-up boxes with info that show the current value for that vertex on the graph. 2. The ability to select a time window by clicking and dragging the cursor across the graph.
This functionality is commonly seen on stock graphs such as finance.yahoo.com or finance.google.com where you can view values across the timeline and select time ranges by highlighting them on the graph with the mouse cursor.
Is this a feature that can be added to Observium? Also, if this is not the appropriate method to issue feature requests please kindly direct me towards the proper method.
Regards,
-=JGR
________________________________
observium mailing list observium@observium.orgmailto:observium@observium.org http://postman.memetic.org/cgi-bin/mailman/listinfo/observium

I get what you’re saying about needing support in the underlying tools & libs. But… how does Smokeping do it, then? It’s also based on RRDtool. If they have a custom graph-rendering front-end, then oh well. But if they’ve managed to layer on top of standard rrdtool libs, it would open up a possible avenue for investigation. Y’know, in your spare time :-). -Adam
Adam Thompson Consultant, Infrastructure Services [[MERLIN LOGO]]https://www.merlin.mb.ca/ 100 - 135 Innovation Drive Winnipeg, MB, R3T 6A8 (204) 977-6824 or 1-800-430-6404 (MB only) athompson@merlin.mb.camailto:athompson@merlin.mb.ca www.merlin.mb.cahttp://www.merlin.mb.ca/
From: observium observium-bounces@observium.org On Behalf Of Adam Armstrong via observium Sent: Thursday, December 19, 2019 5:41 PM To: Justin Radke via observium observium@observium.org Cc: Adam Armstrong adama@memetic.org; Justin Radke justin.radke@directlink.coop Subject: Re: [Observium] Feature Request - Interactive Graphs
This isn't something that can be easily added because of how graphs are generated. It's trivial with a graphing system that supports it and next to impossible with one that doesn't. Since we use RRDtool as our metric storage system, we don't have efficient direct access to the data and rely on RRDtool itself to generate the images. Adam. Sent from BlueMailhttp://www.bluemail.me/r?b=15726 On 19 Dec 2019, at 23:36, Justin Radke via observium <observium@observium.orgmailto:observium@observium.org> wrote: Hello, I have been a user of Observium for quite some time and currently paid subscriber, I have always wanted to see interactive graphs to improve usability. What I am asking for specifically is the ability to:
1. Hover the mouse cursor over the graph and have it show pop-up boxes with info that show the current value for that vertex on the graph. 2. The ability to select a time window by clicking and dragging the cursor across the graph.
This functionality is commonly seen on stock graphs such as finance.yahoo.com or finance.google.com where you can view values across the timeline and select time ranges by highlighting them on the graph with the mouse cursor.
Is this a feature that can be added to Observium? Also, if this is not the appropriate method to issue feature requests please kindly direct me towards the proper method.
Regards,
-=JGR
________________________________
observium mailing list observium@observium.orgmailto:observium@observium.org http://postman.memetic.org/cgi-bin/mailman/listinfo/observium

Smokeping is drawing a single graph.
Adam Armstrong Developer & CEO
Observium Limited https://www.observium.org On 2019-12-20 15:20:07, Adam Thompson via observium observium@observium.org wrote: I get what you’re saying about needing support in the underlying tools & libs. But… how does Smokeping do it, then? It’s also based on RRDtool. If they have a custom graph-rendering front-end, then oh well. But if they’ve managed to layer on top of standard rrdtool libs, it would open up a possible avenue for investigation. Y’know, in your spare time :-). -Adam Adam Thompson Consultant, Infrastructure Services [[MERLIN LOGO]] [https://www.merlin.mb.ca/] 100 - 135 Innovation Drive Winnipeg, MB, R3T 6A8 (204) 977-6824 or 1-800-430-6404 (MB only) athompson@merlin.mb.ca [mailto:athompson@merlin.mb.ca] www.merlin.mb.ca [http://www.merlin.mb.ca/] From: observium observium-bounces@observium.org On Behalf Of Adam Armstrong via observium Sent: Thursday, December 19, 2019 5:41 PM To: Justin Radke via observium observium@observium.org Cc: Adam Armstrong adama@memetic.org; Justin Radke justin.radke@directlink.coop Subject: Re: [Observium] Feature Request - Interactive Graphs This isn't something that can be easily added because of how graphs are generated. It's trivial with a graphing system that supports it and next to impossible with one that doesn't. Since we use RRDtool as our metric storage system, we don't have efficient direct access to the data and rely on RRDtool itself to generate the images. Adam. Sent from BlueMail [http://www.bluemail.me/r?b=15726] On 19 Dec 2019, at 23:36, Justin Radke via observium <observium@observium.org [mailto:observium@observium.org]> wrote: Hello, I have been a user of Observium for quite some time and currently paid subscriber, I have always wanted to see interactive graphs to improve usability. What I am asking for specifically is the ability to: * Hover the mouse cursor over the graph and have it show pop-up boxes with info that show the current value for that vertex on the graph. * The ability to select a time window by clicking and dragging the cursor across the graph. This functionality is commonly seen on stock graphs such as finance.yahoo.com or finance.google.com where you can view values across the timeline and select time ranges by highlighting them on the graph with the mouse cursor. Is this a feature that can be added to Observium? Also, if this is not the appropriate method to issue feature requests please kindly direct me towards the proper method. Regards, -=JGR
observium mailing list observium@observium.org [mailto:observium@observium.org] http://postman.memetic.org/cgi-bin/mailman/listinfo/observium [http://postman.memetic.org/cgi-bin/mailman/listinfo/observium]
Perhaps the mouse hover showing the vertex values is terribly difficult due to it being an image. If we set that aside, is the time window selection with the mouse drag more of a possibility?
-=JGR
From: Adam Thompson athompson@merlin.mb.ca Sent: Friday, December 20, 2019 7:20 AM To: Observium observium@observium.org Cc: Adam Armstrong adama@memetic.org; Justin Radke justin.radke@directlink.coop Subject: RE: Feature Request - Interactive Graphs
I get what you’re saying about needing support in the underlying tools & libs. But… how does Smokeping do it, then? It’s also based on RRDtool. If they have a custom graph-rendering front-end, then oh well. But if they’ve managed to layer on top of standard rrdtool libs, it would open up a possible avenue for investigation. Y’know, in your spare time :-). -Adam
Adam Thompson Consultant, Infrastructure Services [[MERLIN LOGO]]https://www.merlin.mb.ca/ 100 - 135 Innovation Drive Winnipeg, MB, R3T 6A8 (204) 977-6824 or 1-800-430-6404 (MB only) athompson@merlin.mb.camailto:athompson@merlin.mb.ca www.merlin.mb.cahttp://www.merlin.mb.ca/
From: observium <observium-bounces@observium.orgmailto:observium-bounces@observium.org> On Behalf Of Adam Armstrong via observium Sent: Thursday, December 19, 2019 5:41 PM To: Justin Radke via observium <observium@observium.orgmailto:observium@observium.org> Cc: Adam Armstrong <adama@memetic.orgmailto:adama@memetic.org>; Justin Radke <justin.radke@directlink.coopmailto:justin.radke@directlink.coop> Subject: Re: [Observium] Feature Request - Interactive Graphs
This isn't something that can be easily added because of how graphs are generated. It's trivial with a graphing system that supports it and next to impossible with one that doesn't. Since we use RRDtool as our metric storage system, we don't have efficient direct access to the data and rely on RRDtool itself to generate the images. Adam. Sent from BlueMailhttp://www.bluemail.me/r?b=15726 On 19 Dec 2019, at 23:36, Justin Radke via observium <observium@observium.orgmailto:observium@observium.org> wrote: Hello, I have been a user of Observium for quite some time and currently paid subscriber, I have always wanted to see interactive graphs to improve usability. What I am asking for specifically is the ability to:
1. Hover the mouse cursor over the graph and have it show pop-up boxes with info that show the current value for that vertex on the graph. 2. The ability to select a time window by clicking and dragging the cursor across the graph.
This functionality is commonly seen on stock graphs such as finance.yahoo.com or finance.google.com where you can view values across the timeline and select time ranges by highlighting them on the graph with the mouse cursor.
Is this a feature that can be added to Observium? Also, if this is not the appropriate method to issue feature requests please kindly direct me towards the proper method.
Regards,
-=JGR
________________________________
observium mailing list observium@observium.orgmailto:observium@observium.org http://postman.memetic.org/cgi-bin/mailman/listinfo/observium

If all you want is the ability to "zoom" into the graphs, Smokeping uses some javascript to allow you to select across the graph which translates to a time range and fetches a new graph within the selected time frame. Most of the work required is in the Javascript side. I have a custom dashboard using Observium graphs that uses the Smokeping code to allow custom time selection.
If you want interactive graphs like Grafana where you can peek at values under your cursor, that is something else entirely.
________________________________ From: observium observium-bounces@observium.org on behalf of Adam Thompson via observium observium@observium.org Sent: Friday, December 20, 2019 7:19:56 AM To: Observium Cc: Adam Thompson; Justin Radke; Adam Armstrong Subject: Re: [Observium] Feature Request - Interactive Graphs
I get what you’re saying about needing support in the underlying tools & libs. But… how does Smokeping do it, then? It’s also based on RRDtool. If they have a custom graph-rendering front-end, then oh well. But if they’ve managed to layer on top of standard rrdtool libs, it would open up a possible avenue for investigation. Y’know, in your spare time :-). -Adam
Adam Thompson Consultant, Infrastructure Services [[MERLIN LOGO]]https://www.merlin.mb.ca/ 100 - 135 Innovation Drive Winnipeg, MB, R3T 6A8 (204) 977-6824 or 1-800-430-6404 (MB only) athompson@merlin.mb.camailto:athompson@merlin.mb.ca www.merlin.mb.cahttp://www.merlin.mb.ca/
From: observium observium-bounces@observium.org On Behalf Of Adam Armstrong via observium Sent: Thursday, December 19, 2019 5:41 PM To: Justin Radke via observium observium@observium.org Cc: Adam Armstrong adama@memetic.org; Justin Radke justin.radke@directlink.coop Subject: Re: [Observium] Feature Request - Interactive Graphs
This isn't something that can be easily added because of how graphs are generated. It's trivial with a graphing system that supports it and next to impossible with one that doesn't. Since we use RRDtool as our metric storage system, we don't have efficient direct access to the data and rely on RRDtool itself to generate the images. Adam. Sent from BlueMailhttp://www.bluemail.me/r?b=15726 On 19 Dec 2019, at 23:36, Justin Radke via observium <observium@observium.orgmailto:observium@observium.org> wrote: Hello, I have been a user of Observium for quite some time and currently paid subscriber, I have always wanted to see interactive graphs to improve usability. What I am asking for specifically is the ability to:
1. Hover the mouse cursor over the graph and have it show pop-up boxes with info that show the current value for that vertex on the graph. 2. The ability to select a time window by clicking and dragging the cursor across the graph.
This functionality is commonly seen on stock graphs such as finance.yahoo.com or finance.google.com where you can view values across the timeline and select time ranges by highlighting them on the graph with the mouse cursor.
Is this a feature that can be added to Observium? Also, if this is not the appropriate method to issue feature requests please kindly direct me towards the proper method.
Regards,
-=JGR
________________________________
observium mailing list observium@observium.orgmailto:observium@observium.org http://postman.memetic.org/cgi-bin/mailman/listinfo/observium
If you know the position in the image of the graph and the date range of the graph, you can moderately easily work out a date/time from an X coordinate, a range is just doing that twice.
None of us really do much JS, so don't have any way to implement it.
Though honestly, I've never once used zooming functionality on any RRDtool-based tool and found it to be very useful because of the aggregation and data resolution.
Adam.
From: Milton Ngan milton@valvesoftware.com Sent: 07 January 2020 19:41 To: Observium observium@observium.org Cc: Adam Thompson athompson@merlin.mb.ca; Justin Radke justin.radke@directlink.coop; Adam Armstrong adama@memetic.org Subject: Re: Feature Request - Interactive Graphs
If all you want is the ability to "zoom" into the graphs, Smokeping uses some javascript to allow you to select across the graph which translates to a time range and fetches a new graph within the selected time frame. Most of the work required is in the Javascript side. I have a custom dashboard using Observium graphs that uses the Smokeping code to allow custom time selection.
If you want interactive graphs like Grafana where you can peek at values under your cursor, that is something else entirely.
_____
From: observium <observium-bounces@observium.org mailto:observium-bounces@observium.org > on behalf of Adam Thompson via observium <observium@observium.org mailto:observium@observium.org > Sent: Friday, December 20, 2019 7:19:56 AM To: Observium Cc: Adam Thompson; Justin Radke; Adam Armstrong Subject: Re: [Observium] Feature Request - Interactive Graphs
I get what you're saying about needing support in the underlying tools & libs.
But. how does Smokeping do it, then? It's also based on RRDtool. If they have a custom graph-rendering front-end, then oh well. But if they've managed to layer on top of standard rrdtool libs, it would open up a possible avenue for investigation. Y'know, in your spare time :-).
-Adam
Adam Thompson Consultant, Infrastructure Services https://www.merlin.mb.ca/ 100 - 135 Innovation Drive Winnipeg, MB, R3T 6A8 (204) 977-6824 or 1-800-430-6404 (MB only) mailto:athompson@merlin.mb.ca athompson@merlin.mb.ca http://www.merlin.mb.ca/ www.merlin.mb.ca
From: observium <observium-bounces@observium.org mailto:observium-bounces@observium.org > On Behalf Of Adam Armstrong via observium Sent: Thursday, December 19, 2019 5:41 PM To: Justin Radke via observium <observium@observium.org mailto:observium@observium.org > Cc: Adam Armstrong <adama@memetic.org mailto:adama@memetic.org >; Justin Radke <justin.radke@directlink.coop mailto:justin.radke@directlink.coop > Subject: Re: [Observium] Feature Request - Interactive Graphs
This isn't something that can be easily added because of how graphs are generated.
It's trivial with a graphing system that supports it and next to impossible with one that doesn't.
Since we use RRDtool as our metric storage system, we don't have efficient direct access to the data and rely on RRDtool itself to generate the images.
Adam.
Sent from BlueMail http://www.bluemail.me/r?b=15726
On 19 Dec 2019, at 23:36, Justin Radke via observium <observium@observium.org mailto:observium@observium.org > wrote:
Hello, I have been a user of Observium for quite some time and currently paid subscriber, I have always wanted to see interactive graphs to improve usability. What I am asking for specifically is the ability to:
1. Hover the mouse cursor over the graph and have it show pop-up boxes with info that show the current value for that vertex on the graph. 2. The ability to select a time window by clicking and dragging the cursor across the graph.
This functionality is commonly seen on stock graphs such as finance.yahoo.com or finance.google.com where you can view values across the timeline and select time ranges by highlighting them on the graph with the mouse cursor.
Is this a feature that can be added to Observium? Also, if this is not the appropriate method to issue feature requests please kindly direct me towards the proper method.
Regards,
-=JGR
_____
observium mailing list observium@observium.org mailto:observium@observium.org http://postman.memetic.org/cgi-bin/mailman/listinfo/observium

I often find myself trying to zoom in on a peak value in the graph. For this reason I have already asked for this feature via the mailing list a while ago.
So if this could be implemented with the kind help of Milton, I would be very happy. :)
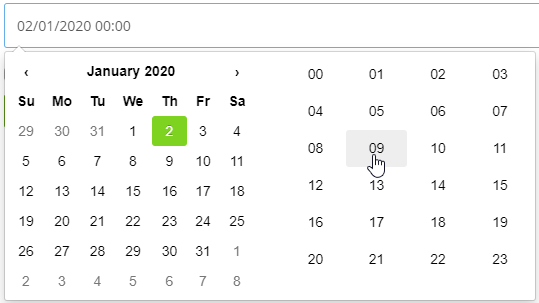
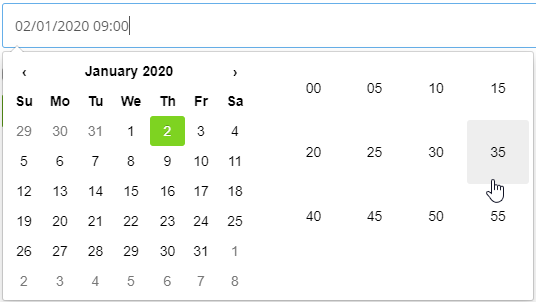
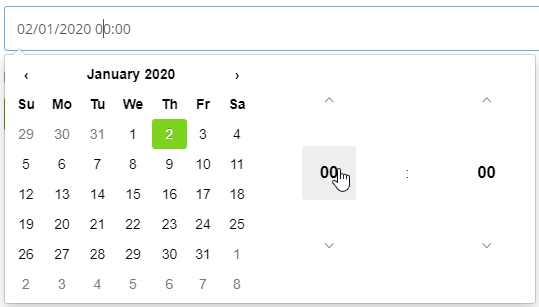
If it can't be implemented, I would be happy if at least the input of the times could be made a bit more comfortable. Currently, this has to be typed into the field manually. With our Cachet Status Page, for example, this works quite well with just a few mouse clicks. Screenshots are available in the Attachment.
Siegfried
Von: observium observium-bounces@observium.org Im Auftrag von adama--- via observium Gesendet: Mittwoch, 8. Jänner 2020 03:11 An: 'Observium' observium@observium.org Cc: adama@observium.org Betreff: Re: [Observium] Feature Request - Interactive Graphs
If you know the position in the image of the graph and the date range of the graph, you can moderately easily work out a date/time from an X coordinate, a range is just doing that twice.
None of us really do much JS, so don't have any way to implement it.
Though honestly, I've never once used zooming functionality on any RRDtool-based tool and found it to be very useful because of the aggregation and data resolution.
Adam.
From: Milton Ngan <milton@valvesoftware.commailto:milton@valvesoftware.com> Sent: 07 January 2020 19:41 To: Observium <observium@observium.orgmailto:observium@observium.org> Cc: Adam Thompson <athompson@merlin.mb.camailto:athompson@merlin.mb.ca>; Justin Radke <justin.radke@directlink.coopmailto:justin.radke@directlink.coop>; Adam Armstrong <adama@memetic.orgmailto:adama@memetic.org> Subject: Re: Feature Request - Interactive Graphs
If all you want is the ability to "zoom" into the graphs, Smokeping uses some javascript to allow you to select across the graph which translates to a time range and fetches a new graph within the selected time frame. Most of the work required is in the Javascript side. I have a custom dashboard using Observium graphs that uses the Smokeping code to allow custom time selection.
If you want interactive graphs like Grafana where you can peek at values under your cursor, that is something else entirely.
________________________________ From: observium <observium-bounces@observium.orgmailto:observium-bounces@observium.org> on behalf of Adam Thompson via observium <observium@observium.orgmailto:observium@observium.org> Sent: Friday, December 20, 2019 7:19:56 AM To: Observium Cc: Adam Thompson; Justin Radke; Adam Armstrong Subject: Re: [Observium] Feature Request - Interactive Graphs
I get what you're saying about needing support in the underlying tools & libs. But... how does Smokeping do it, then? It's also based on RRDtool. If they have a custom graph-rendering front-end, then oh well. But if they've managed to layer on top of standard rrdtool libs, it would open up a possible avenue for investigation. Y'know, in your spare time :-). -Adam
Adam Thompson Consultant, Infrastructure Services [[MERLIN LOGO]]https://www.merlin.mb.ca/ 100 - 135 Innovation Drive Winnipeg, MB, R3T 6A8 (204) 977-6824 or 1-800-430-6404 (MB only) athompson@merlin.mb.camailto:athompson@merlin.mb.ca www.merlin.mb.cahttp://www.merlin.mb.ca/
From: observium <observium-bounces@observium.orgmailto:observium-bounces@observium.org> On Behalf Of Adam Armstrong via observium Sent: Thursday, December 19, 2019 5:41 PM To: Justin Radke via observium <observium@observium.orgmailto:observium@observium.org> Cc: Adam Armstrong <adama@memetic.orgmailto:adama@memetic.org>; Justin Radke <justin.radke@directlink.coopmailto:justin.radke@directlink.coop> Subject: Re: [Observium] Feature Request - Interactive Graphs
This isn't something that can be easily added because of how graphs are generated. It's trivial with a graphing system that supports it and next to impossible with one that doesn't. Since we use RRDtool as our metric storage system, we don't have efficient direct access to the data and rely on RRDtool itself to generate the images. Adam. Sent from BlueMailhttp://www.bluemail.me/r?b=15726 On 19 Dec 2019, at 23:36, Justin Radke via observium <observium@observium.orgmailto:observium@observium.org> wrote: Hello, I have been a user of Observium for quite some time and currently paid subscriber, I have always wanted to see interactive graphs to improve usability. What I am asking for specifically is the ability to:
1. Hover the mouse cursor over the graph and have it show pop-up boxes with info that show the current value for that vertex on the graph. 2. The ability to select a time window by clicking and dragging the cursor across the graph.
This functionality is commonly seen on stock graphs such as finance.yahoo.com or finance.google.com where you can view values across the timeline and select time ranges by highlighting them on the graph with the mouse cursor.
Is this a feature that can be added to Observium? Also, if this is not the appropriate method to issue feature requests please kindly direct me towards the proper method.
Regards,
-=JGR
________________________________
observium mailing list observium@observium.orgmailto:observium@observium.org http://postman.memetic.org/cgi-bin/mailman/listinfo/observium

Graphite supports RRD files as a data source; why wouldn't you just use Graphite -> Grafana? Am I missing something obvious?
In addition to different styles of interactive graphs, you'd be able to do metric calculations in the graphs as well, take advantage of dashboard templating and variables, etc etc.. My company used a collector -> rrd -> graphite -> grafana system for years, for systems generating trillions of metrics per day. It's very flexible/performant.
On Tue, Jan 7, 2020 at 11:41 AM Milton Ngan via observium < observium@observium.org> wrote:
If all you want is the ability to "zoom" into the graphs, Smokeping uses some javascript to allow you to select across the graph which translates to a time range and fetches a new graph within the selected time frame. Most of the work required is in the Javascript side. I have a custom dashboard using Observium graphs that uses the Smokeping code to allow custom time selection.
If you want interactive graphs like Grafana where you can peek at values under your cursor, that is something else entirely.
*From:* observium observium-bounces@observium.org on behalf of Adam Thompson via observium observium@observium.org *Sent:* Friday, December 20, 2019 7:19:56 AM *To:* Observium *Cc:* Adam Thompson; Justin Radke; Adam Armstrong *Subject:* Re: [Observium] Feature Request - Interactive Graphs
I get what you’re saying about needing support in the underlying tools & libs.
But… how does Smokeping do it, then? It’s also based on RRDtool. If they have a custom graph-rendering front-end, then oh well. But if they’ve managed to layer on top of standard rrdtool libs, it would open up a possible avenue for investigation. Y’know, in your spare time :-).
-Adam
*Adam Thompson* Consultant, Infrastructure Services *[image: [MERLIN LOGO]]* https://www.merlin.mb.ca/ 100 - 135 Innovation Drive Winnipeg, MB, R3T 6A8 (204) 977-6824 or 1-800-430-6404 (MB only) athompson@merlin.mb.ca www.merlin.mb.ca
*From:* observium observium-bounces@observium.org *On Behalf Of *Adam Armstrong via observium *Sent:* Thursday, December 19, 2019 5:41 PM *To:* Justin Radke via observium observium@observium.org *Cc:* Adam Armstrong adama@memetic.org; Justin Radke < justin.radke@directlink.coop> *Subject:* Re: [Observium] Feature Request - Interactive Graphs
This isn't something that can be easily added because of how graphs are generated.
It's trivial with a graphing system that supports it and next to impossible with one that doesn't.
Since we use RRDtool as our metric storage system, we don't have efficient direct access to the data and rely on RRDtool itself to generate the images.
Adam.
Sent from BlueMail http://www.bluemail.me/r?b=15726
On 19 Dec 2019, at 23:36, Justin Radke via observium < observium@observium.org> wrote:
Hello, I have been a user of Observium for quite some time and currently paid subscriber, I have always wanted to see interactive graphs to improve usability. What I am asking for specifically is the ability to:
- Hover the mouse cursor over the graph and have it show pop-up boxes
with info that show the current value for that vertex on the graph. 2. The ability to select a time window by clicking and dragging the cursor across the graph.
This functionality is commonly seen on stock graphs such as finance.yahoo.com or finance.google.com where you can view values across the timeline and select time ranges by highlighting them on the graph with the mouse cursor.
Is this a feature that can be added to Observium? Also, if this is not the appropriate method to issue feature requests please kindly direct me towards the proper method.
Regards,
-=JGR
observium mailing list observium@observium.org http://postman.memetic.org/cgi-bin/mailman/listinfo/observium
observium mailing list observium@observium.org http://postman.memetic.org/cgi-bin/mailman/listinfo/observium
participants (8)
-
 Aaron Finney
 -
 Adam Armstrong
 -
 Adam Armstrong
 -
 Adam Thompson
 -
adama@observium.org
-
 Gumilar Siegfried MSc.
 -
 Justin Radke
 -
 Milton Ngan