generation of false alarm ?

Hello,
What could be the reason of the generation of false alarm:
*ALERT*
Modify http://10.13.40.217/device/device=382/tab=alert/alert_entry=7751/
*Alert*
*MoreThan80PortUtilization*
*Entity*
*Ethernet1/51 http://10.13.40.217/device/device=382/tab=port/port=1694030/*
*Descr*
NXOS1-ITXx2
*Conditions*
ifOutOctets_perc ge 80 (395649)
*Metrics*
ifInOctets_perc = 11 * ifOutOctets_perc = 395649*
*Duration*
10m 8s (2017-11-08 02:18:10)
As you coud notice the *ifOutOctets_perc = 395649 * shows some irregular value, which's not on the graphs itself, but the alarm is generated.
During migration the migration period from old observium server to new one, at same time we have two observiums running, so older one have the same alerts configured - but that (older one) haven't generated any false alarm. So - waht could be the reason ?
Thanks!

My Guess is that you are polling a Cisco Nexus which have a broken SNMP-stack, it sometimes reports crazy values for a couple of seconds. If you are not already running it, try uppgrade to nx-os 7.x Otherwise you can work around the problem by reconfigure you alert check with "delay 2" which will cause it to not send an alert unless the value is above the threshold for 2 polls in a row.
/Markus
Den 8 nov. 2017 08:15 skrev "Edvinas K" edvinas.email@gmail.com:
Hello,
What could be the reason of the generation of false alarm:
*ALERT*
Modify http://10.13.40.217/device/device=382/tab=alert/alert_entry=7751/
*Alert*
*MoreThan80PortUtilization*
*Entity*
*Ethernet1/51 http://10.13.40.217/device/device=382/tab=port/port=1694030/*
*Descr*
NXOS1-ITXx2
*Conditions*
ifOutOctets_perc ge 80 (395649)
*Metrics*
ifInOctets_perc = 11
- ifOutOctets_perc = 395649*
*Duration*
10m 8s (2017-11-08 02:18:10)
As you coud notice the *ifOutOctets_perc = 395649 * shows some irregular value, which's not on the graphs itself, but the alarm is generated.
During migration the migration period from old observium server to new one, at same time we have two observiums running, so older one have the same alerts configured - but that (older one) haven't generated any false alarm. So - waht could be the reason ?
Thanks!
observium mailing list observium@observium.org http://postman.memetic.org/cgi-bin/mailman/listinfo/observium

Hi
We have the same problem with Nexus 5K and 7.1(4)N1(1).
Is there any option to set up an alerts with a from.. and to.. values? Like if the value greather than 80% but lower than 100% send the alarm? In this case this percentage problem doesn't appear. Normally the alert just run if the percentage is over 80. Can we use an "AND" tag somehow?
Thanks
Laszlo
On 2017-11-08 08:32, Markus Klock wrote:
My Guess is that you are polling a Cisco Nexus which have a broken SNMP-stack, it sometimes reports crazy values for a couple of seconds. If you are not already running it, try uppgrade to nx-os 7.x Otherwise you can work around the problem by reconfigure you alert check with "delay 2" which will cause it to not send an alert unless the value is above the threshold for 2 polls in a row.
/Markus
Den 8 nov. 2017 08:15 skrev "Edvinas K" <edvinas.email@gmail.com mailto:edvinas.email@gmail.com>:
Hello,

What could be the reason of the generation of false alarm:


*ALERT*


Modify
<http://10.13.40.217/device/device=382/tab=alert/alert_entry=7751/>

*Alert*


*MoreThan80PortUtilization*

*Entity*


*Ethernet1/51
<http://10.13.40.217/device/device=382/tab=port/port=1694030/>*

*Descr*


NXOS1-ITXx2

*Conditions*


ifOutOctets_perc ge 80 (395649)

*Metrics*


ifInOctets_perc = 11
*ifOutOctets_perc = 395649*

*Duration*


10m 8s (2017-11-08 02:18:10)


As you coud notice the *ifOutOctets_perc = 395649 * shows some
irregular value, which's not on the graphs itself, but the alarm
is generated.

During migration the migration period from old observium server to
new one, at same time we have two observiums running, so older one
have the same alerts configured - but that (older one) haven't
generated any false alarm.
So - waht could be the reason ?

Thanks!

_______________________________________________
observium mailing list
observium@observium.org <mailto:observium@observium.org>
http://postman.memetic.org/cgi-bin/mailman/listinfo/observium
<http://postman.memetic.org/cgi-bin/mailman/listinfo/observium>
observium mailing list observium@observium.org http://postman.memetic.org/cgi-bin/mailman/listinfo/observium

You just put two lines in the alert definition.
blah gt 80 blah lt 100
Adam Armstrong CEO & Lead Architect Observium Limited On 2017-11-08 11:00:35, Laszlo Nemeth lnemeth@emarsys.com wrote: Hi We have the same problem with Nexus 5K and 7.1(4)N1(1). Is there any option to set up an alerts with a from.. and to.. values? Like if the value greather than 80% but lower than 100% send the alarm? In this case this percentage problem doesn't appear. Normally the alert just run if the percentage is over 80. Can we use an "AND" tag somehow?
Thanks Laszlo
On 2017-11-08 08:32, Markus Klock wrote:
My Guess is that you are polling a Cisco Nexus which have a broken SNMP-stack, it sometimes reports crazy values for a couple of seconds. If you are not already running it, try uppgrade to nx-os 7.x Otherwise you can work around the problem by reconfigure you alert check with "delay 2" which will cause it to not send an alert unless the value is above the threshold for 2 polls in a row.
/Markus
Den 8 nov. 2017 08:15 skrev "Edvinas K" <edvinas.email@gmail.com [mailto:edvinas.email@gmail.com]>:
Hello,
What could be the reason of the generation of false alarm:
ALERT Modify [http://10.13.40.217/device/device=382/tab=alert/alert_entry=7751/] Alert MoreThan80PortUtilization Entity Ethernet1/51 [http://10.13.40.217/device/device=382/tab=port/port=1694030/] Descr NXOS1-ITXx2 Conditions ifOutOctets_perc ge 80 (395649) Metrics ifInOctets_perc = 11 ifOutOctets_perc = 395649 Duration 10m 8s (2017-11-08 02:18:10)
As you coud notice the ifOutOctets_perc = 395649 shows some irregular value, which's not on the graphs itself, but the alarm is generated.
During migration the migration period from old observium server to new one, at same time we have two observiums running, so older one have the same alerts configured - but that (older one) haven't generated any false alarm. So - waht could be the reason ?
Thanks!
_______________________________________________ observium mailing list observium@observium.org [mailto:observium@observium.org] http://postman.memetic.org/cgi-bin/mailman/listinfo/observium [http://postman.memetic.org/cgi-bin/mailman/listinfo/observium]
_______________________________________________ observium mailing list observium@observium.org [mailto:observium@observium.org] http://postman.memetic.org/cgi-bin/mailman/listinfo/observium [http://postman.memetic.org/cgi-bin/mailman/listinfo/observium]
-- emarsys László Németh Senior Network Engineer [emarsys] [http://www.emarsys.com/] Emarsys-Technologies Kft Kossuth Lajos utca 7-9. II. emelet 1053 Budapest T: +36 1 781 6001 [tel:+36%201%20781%206001] E: laszlo.nemeth@emarsys.com [mailto:laszlo.nemeth@emarsys.com] W: www.emarsys.com [http://www.emarsys.com] » Get the latest insight from Emarsys [http://emarsys.com/en/resources/whitepapers/] This email and any attachments contain confidential information for the intended recipient to which it has been addressed. This information may not be copied nor disclosed to any third party without prior permission of the sender. If you are not the intended recipient, or if received in error, please contact the sender immediately and delete this email from your system. emarsys eMarketing Systems AG does not accept responsibility for losses and any other damages resulting from information, including viruses and other harmful content, contained in this email and any attachments.
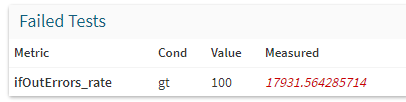
thank you seems it works, the same issue is with error counter. But this time is the rate, not percents. I think we could apply the same logic.
[image: Inline image 2]
So maybe you can recommend the safe and realistic value to add in ifOutErrors_rate lt ?
Thank you
On Wed, Nov 8, 2017 at 3:17 PM, Adam Armstrong adama@observium.org wrote:
You just put two lines in the alert definition.
blah gt 80 blah lt 100
Adam Armstrong CEO & Lead Architect Observium Limited
On 2017-11-08 11:00:35, Laszlo Nemeth lnemeth@emarsys.com wrote:
Hi
We have the same problem with Nexus 5K and 7.1(4)N1(1).
Is there any option to set up an alerts with a from.. and to.. values? Like if the value greather than 80% but lower than 100% send the alarm? In this case this percentage problem doesn't appear. Normally the alert just run if the percentage is over 80. Can we use an "AND" tag somehow?
Thanks
Laszlo
On 2017-11-08 08:32, Markus Klock wrote:
My Guess is that you are polling a Cisco Nexus which have a broken SNMP-stack, it sometimes reports crazy values for a couple of seconds. If you are not already running it, try uppgrade to nx-os 7.x Otherwise you can work around the problem by reconfigure you alert check with "delay 2" which will cause it to not send an alert unless the value is above the threshold for 2 polls in a row.
/Markus
Den 8 nov. 2017 08:15 skrev "Edvinas K" edvinas.email@gmail.com:
Hello,
What could be the reason of the generation of false alarm:
*ALERT*
Modify http://10.13.40.217/device/device=382/tab=alert/alert_entry=7751/
*Alert*
*MoreThan80PortUtilization*
*Entity*
*Ethernet1/51 http://10.13.40.217/device/device=382/tab=port/port=1694030/*
*Descr*
NXOS1-ITXx2
*Conditions*
ifOutOctets_perc ge 80 (395649)
*Metrics*
ifInOctets_perc = 11
- ifOutOctets_perc = 395649*
*Duration*
10m 8s (2017-11-08 02:18:10)
As you coud notice the *ifOutOctets_perc = 395649 * shows some irregular value, which's not on the graphs itself, but the alarm is generated.
During migration the migration period from old observium server to new one, at same time we have two observiums running, so older one have the same alerts configured - but that (older one) haven't generated any false alarm. So - waht could be the reason ?
Thanks!
observium mailing list observium@observium.org http://postman.memetic.org/cgi-bin/mailman/listinfo/observium
observium mailing listobservium@observium.orghttp://postman.memetic.org/cgi-bin/mailman/listinfo/observium
-- *László Németh* Senior Network Engineer [image: emarsys] http://www.emarsys.com/ Emarsys-Technologies Kft Kossuth Lajos utca 7-9. II. emelet 1053 Budapest *T:* +36 1 781 6001 <+36%201%20781%206001> *E:* laszlo.nemeth@emarsys.com *W:* www.emarsys.com *» Get the latest insight from Emarsys* http://emarsys.com/en/resources/whitepapers/ This email and any attachments contain confidential information for the intended recipient to which it has been addressed. This information may not be copied nor disclosed to any third party without prior permission of the sender. If you are not the intended recipient, or if received in error, please contact the sender immediately and delete this email from your system. emarsys eMarketing Systems AG does not accept responsibility for losses and any other damages resulting from information, including viruses and other harmful content, contained in this email and any attachments.
observium mailing list observium@observium.org http://postman.memetic.org/cgi-bin/mailman/listinfo/observium
I used this until now:
ifInOctets_perc ge 20 ifOutOctets_perc ge 20 ifInErrors_rate gt 1 ifOutErrors_rate gt 1 ifOperStatus notequals up
looks like the relation is OR between the lines . I added the "ifInOctets_perc lt 100" and "ifInOctets_perc lt 100" lines in this alert and i got continuously alerts because the percentage are always under 100% :)
I made a mistake or the realtion is OR instead of AND ?
Laszlo
On 2017-11-08 14:17, Adam Armstrong wrote:
You just put two lines in the alert definition.
blah gt 80 blah lt 100
Adam Armstrong CEO & Lead Architect Observium Limited
On 2017-11-08 11:00:35, Laszlo Nemeth lnemeth@emarsys.com wrote:
Hi
We have the same problem with Nexus 5K and 7.1(4)N1(1).
Is there any option to set up an alerts with a from.. and to.. values? Like if the value greather than 80% but lower than 100% send the alarm? In this case this percentage problem doesn't appear. Normally the alert just run if the percentage is over 80. Can we use an "AND" tag somehow?
Thanks
Laszlo
On 2017-11-08 08:32, Markus Klock wrote:
My Guess is that you are polling a Cisco Nexus which have a broken SNMP-stack, it sometimes reports crazy values for a couple of seconds. If you are not already running it, try uppgrade to nx-os 7.x Otherwise you can work around the problem by reconfigure you alert check with "delay 2" which will cause it to not send an alert unless the value is above the threshold for 2 polls in a row.
/Markus
Den 8 nov. 2017 08:15 skrev "Edvinas K" <edvinas.email@gmail.com mailto:edvinas.email@gmail.com>:
Hello,

What could be the reason of the generation of false alarm:


*ALERT*


Modify
<http://10.13.40.217/device/device=382/tab=alert/alert_entry=7751/>

*Alert*


*MoreThan80PortUtilization*

*Entity*


*Ethernet1/51
<http://10.13.40.217/device/device=382/tab=port/port=1694030/>*

*Descr*


NXOS1-ITXx2

*Conditions*


ifOutOctets_perc ge 80 (395649)

*Metrics*


ifInOctets_perc = 11
*ifOutOctets_perc = 395649*

*Duration*


10m 8s (2017-11-08 02:18:10)


As you coud notice the *ifOutOctets_perc = 395649 * shows some
irregular value, which's not on the graphs itself, but the alarm
is generated.

During migration the migration period from old observium server
to new one, at same time we have two observiums running, so
older one have the same alerts configured - but that (older one)
haven't generated any false alarm.
So - waht could be the reason ?

Thanks!

_______________________________________________
observium mailing list
observium@observium.org <mailto:observium@observium.org>
http://postman.memetic.org/cgi-bin/mailman/listinfo/observium
<http://postman.memetic.org/cgi-bin/mailman/listinfo/observium>
observium mailing list observium@observium.org http://postman.memetic.org/cgi-bin/mailman/listinfo/observium
-- emarsys *László Németh* Senior Network Engineer emarsys http://www.emarsys.com/
Emarsys-Technologies Kft Kossuth Lajos utca 7-9. II. emelet 1053 Budapest *T:* +36 1 781 6001 tel:+36%201%20781%206001 *E:* laszlo.nemeth@emarsys.com mailto:laszlo.nemeth@emarsys.com *W:* www.emarsys.com http://www.emarsys.com
*» Get the latest insight from Emarsys* http://emarsys.com/en/resources/whitepapers/ This email and any attachments contain confidential information for the intended recipient to which it has been addressed. This information may not be copied nor disclosed to any third party without prior permission of the sender. If you are not the intended recipient, or if received in error, please contact the sender immediately and delete this email from your system. emarsys eMarketing Systems AG does not accept responsibility for losses and any other damages resulting from information, including viruses and other harmful content, contained in this email and any attachments.
observium mailing list observium@observium.org http://postman.memetic.org/cgi-bin/mailman/listinfo/observium

Did you see the "Require any condition" / "Require all conditions" dropdown on top? ;-)
Tom
On 09/11/2017 14:48, Laszlo Nemeth wrote:
I used this until now:
ifInOctets_perc ge 20 ifOutOctets_perc ge 20 ifInErrors_rate gt 1 ifOutErrors_rate gt 1 ifOperStatus notequals up
looks like the relation is OR between the lines . I added the "ifInOctets_perc lt 100" and "ifInOctets_perc lt 100" lines in this alert and i got continuously alerts because the percentage are always under 100% :)
I made a mistake or the realtion is OR instead of AND ?
Laszlo
On 2017-11-08 14:17, Adam Armstrong wrote:
You just put two lines in the alert definition.
blah gt 80 blah lt 100
Adam Armstrong CEO & Lead Architect Observium Limited
On 2017-11-08 11:00:35, Laszlo Nemeth lnemeth@emarsys.com wrote:
Hi
We have the same problem with Nexus 5K and 7.1(4)N1(1).
Is there any option to set up an alerts with a from.. and to.. values? Like if the value greather than 80% but lower than 100% send the alarm? In this case this percentage problem doesn't appear. Normally the alert just run if the percentage is over 80. Can we use an "AND" tag somehow?
Thanks
Laszlo
On 2017-11-08 08:32, Markus Klock wrote:
My Guess is that you are polling a Cisco Nexus which have a broken SNMP-stack, it sometimes reports crazy values for a couple of seconds. If you are not already running it, try uppgrade to nx-os 7.x Otherwise you can work around the problem by reconfigure you alert check with "delay 2" which will cause it to not send an alert unless the value is above the threshold for 2 polls in a row.
/Markus
Den 8 nov. 2017 08:15 skrev "Edvinas K" <edvinas.email@gmail.com mailto:edvinas.email@gmail.com>:
Hello,

What could be the reason of the generation of false alarm:


*ALERT*


Modify
<http://10.13.40.217/device/device=382/tab=alert/alert_entry=7751/>

*Alert*


*MoreThan80PortUtilization*

*Entity*


*Ethernet1/51
<http://10.13.40.217/device/device=382/tab=port/port=1694030/>*

*Descr*


NXOS1-ITXx2

*Conditions*


ifOutOctets_perc ge 80 (395649)

*Metrics*


ifInOctets_perc = 11
*ifOutOctets_perc = 395649*

*Duration*


10m 8s (2017-11-08 02:18:10)


As you coud notice the *ifOutOctets_perc = 395649 * shows some
irregular value, which's not on the graphs itself, but the
alarm is generated.

During migration the migration period from old observium server
to new one, at same time we have two observiums running, so
older one have the same alerts configured - but that (older
one) haven't generated any false alarm.
So - waht could be the reason ?

Thanks!

_______________________________________________
observium mailing list
observium@observium.org <mailto:observium@observium.org>
http://postman.memetic.org/cgi-bin/mailman/listinfo/observium
<http://postman.memetic.org/cgi-bin/mailman/listinfo/observium>
Here is mine example: to manage this i created two separate checkers, one for Inbound traffic, other for Outbound. And applied in that way:
[image: Inline image 1]
The same with Outbound.
Seems that fixes enormous counters on traffic utilization, still thinking what to do with error count rate
HTH
On Fri, Nov 10, 2017 at 12:00 AM, Tom Laermans tom.laermans@powersource.cx wrote:
Did you see the "Require any condition" / "Require all conditions" dropdown on top? ;-)
Tom
On 09/11/2017 14:48, Laszlo Nemeth wrote:
I used this until now:
ifInOctets_perc ge 20 ifOutOctets_perc ge 20 ifInErrors_rate gt 1 ifOutErrors_rate gt 1 ifOperStatus notequals up
looks like the relation is OR between the lines . I added the "ifInOctets_perc lt 100" and "ifInOctets_perc lt 100" lines in this alert and i got continuously alerts because the percentage are always under 100% :)
I made a mistake or the realtion is OR instead of AND ?
Laszlo
On 2017-11-08 14:17, Adam Armstrong wrote:
You just put two lines in the alert definition.
blah gt 80 blah lt 100
Adam Armstrong CEO & Lead Architect Observium Limited
On 2017-11-08 11:00:35, Laszlo Nemeth lnemeth@emarsys.com lnemeth@emarsys.com wrote:
Hi
We have the same problem with Nexus 5K and 7.1(4)N1(1).
Is there any option to set up an alerts with a from.. and to.. values? Like if the value greather than 80% but lower than 100% send the alarm? In this case this percentage problem doesn't appear. Normally the alert just run if the percentage is over 80. Can we use an "AND" tag somehow?
Thanks
Laszlo
On 2017-11-08 08:32, Markus Klock wrote:
My Guess is that you are polling a Cisco Nexus which have a broken SNMP-stack, it sometimes reports crazy values for a couple of seconds. If you are not already running it, try uppgrade to nx-os 7.x Otherwise you can work around the problem by reconfigure you alert check with "delay 2" which will cause it to not send an alert unless the value is above the threshold for 2 polls in a row.
/Markus
Den 8 nov. 2017 08:15 skrev "Edvinas K" edvinas.email@gmail.com:
Hello,
What could be the reason of the generation of false alarm:
*ALERT*
Modify http://10.13.40.217/device/device=382/tab=alert/alert_entry=7751/
*Alert*
*MoreThan80PortUtilization*
*Entity*
*Ethernet1/51 http://10.13.40.217/device/device=382/tab=port/port=1694030/*
*Descr*
NXOS1-ITXx2
*Conditions*
ifOutOctets_perc ge 80 (395649)
*Metrics*
ifInOctets_perc = 11
- ifOutOctets_perc = 395649*
*Duration*
10m 8s (2017-11-08 02:18:10)
As you coud notice the *ifOutOctets_perc = 395649 * shows some irregular value, which's not on the graphs itself, but the alarm is generated.
During migration the migration period from old observium server to new one, at same time we have two observiums running, so older one have the same alerts configured - but that (older one) haven't generated any false alarm. So - waht could be the reason ?
Thanks!
observium mailing list observium@observium.org http://postman.memetic.org/cgi-bin/mailman/listinfo/observium
observium mailing list observium@observium.org http://postman.memetic.org/cgi-bin/mailman/listinfo/observium
participants (5)
-
 Adam Armstrong
 -
 Edvinas K
 -
 Laszlo Nemeth
 -
 Markus Klock
 -
 Tom Laermans