
Hi,
On (seemingly all) our device port pages I get different values in the legends on the page of graphs vs their respective hover over pop-up graphs? In theory I thought they're showing the same timeframe/data?
Regards, Emma

On 2014-06-24 05:25, Cardinal-Richards, Emma wrote:
Hi,
On (seemingly all) our device port pages I get different values in the legends on the page of graphs vs their respective hover over pop-up graphs? In theory I thought they're showing the same timeframe/data?
	RRD gonna do what RRD gonna do!

	RRD generates the legend based on the data it has
decided to use for the graph. This depends on the time period and the resolution of the data. None of our code is involved in any of this.
Note that without a screenshot, no one knows what you're talking about, and even fewer people are going to try to guess.
adam.
Ok on holiday right now but will provide screenshots on my return....
On 25 Jun 2014, at 20:35, Adam Armstrong adama@memetic.org wrote:
On 2014-06-24 05:25, Cardinal-Richards, Emma wrote: Hi, On (seemingly all) our device port pages I get different values in the legends on the page of graphs vs their respective hover over pop-up graphs? In theory I thought they're showing the same timeframe/data?
RRD gonna do what RRD gonna do!
RRD generates the legend based on the data it has decided to use for the graph. This depends on the time period and the resolution of the data. None of our code is involved in any of this.
Note that without a screenshot, no one knows what you're talking about, and even fewer people are going to try to guess.
adam. _______________________________________________ observium mailing list observium@observium.org http://postman.memetic.org/cgi-bin/mailman/listinfo/observium
On 25 Jun 2014, at 20:35, Adam Armstrong adama@memetic.org wrote:
On 2014-06-24 05:25, Cardinal-Richards, Emma wrote: Hi, On (seemingly all) our device port pages I get different values in the legends on the page of graphs vs their respective hover over pop-up graphs? In theory I thought they're showing the same timeframe/data?
RRD gonna do what RRD gonna do!
RRD generates the legend based on the data it has decided to use for the
graph. This depends on the time period and the resolution of the data. None of our code is involved in any of this.
Note that without a screenshot, no one knows what you're talking about,
and even fewer people are going to try to guess.


	adam.
I know you were anxiously awaiting this....
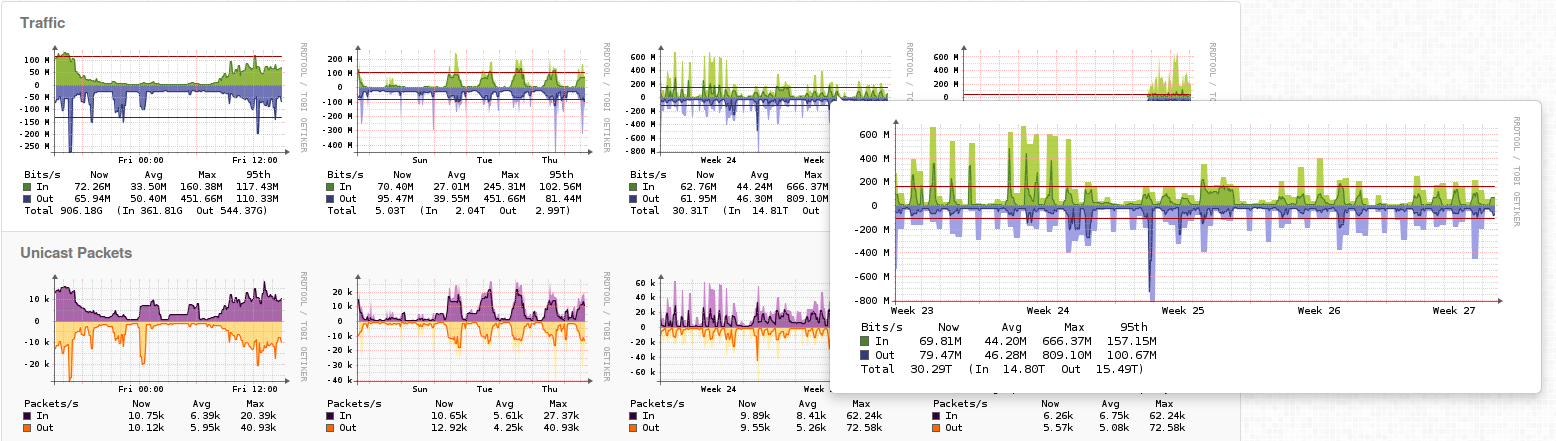
I've attached a screenshot as an example, the popup graph is of the 3rd graph along. The numerical values differ, this seems to be the same on the majority of graphs not just 'traffic', and not for all values (some match).
Emma

Hi Emma,
We send the same command to rrdtool for both graphs (apart from height/wIdth).
Obviously if a poll happened after the page was loaded but before you hovered, data will differ. But I know that's not what you mean, after all that's a 5 minute window where in that theory the graphs should be equal.
I -think- RRDtool may base its data also on averages which are calculated wrt the time difference between the last poll and the current time (meaning that every second up to the next poll time may give you other data points if it needs to average out). But that may very well be total BS.
Long story short, no idea, but we're not drawing the graphs ourselves; maybe the rrdtool guys know more.
Tom
On 07/04/2014 04:03 PM, Cardinal-Richards, Emma wrote:
On 25 Jun 2014, at 20:35, Adam Armstrong adama@memetic.org wrote:
On 2014-06-24 05:25, Cardinal-Richards, Emma wrote: Hi, On (seemingly all) our device port pages I get different values in the legends on the page of graphs vs their respective hover over pop-up graphs? In theory I thought they're showing the same timeframe/data?
RRD gonna do what RRD gonna do!
RRD generates the legend based on the data it has decided to use for the
graph. This depends on the time period and the resolution of the data. None of our code is involved in any of this.
Note that without a screenshot, no one knows what you're talking about,
and even fewer people are going to try to guess.
adam.
I know you were anxiously awaiting this....
I've attached a screenshot as an example, the popup graph is of the 3rd graph along. The numerical values differ, this seems to be the same on the majority of graphs not just 'traffic', and not for all values (some match).
Emma
observium mailing list observium@observium.org http://postman.memetic.org/cgi-bin/mailman/listinfo/observium
-----Original Message----- From: observium [mailto:observium-bounces@observium.org] On Behalf Of Tom Laermans Sent: 04 July 2014 15:10 To: Observium Network Observation System Subject: Re: [Observium] Differing values
Hi Emma,
We send the same command to rrdtool for both graphs (apart from height/wIdth).
Obviously if a poll happened after the page was loaded but before you hovered, data will differ. But I know that's not what you mean, after all that's a 5 minute window where in that theory the graphs should be equal.
I -think- RRDtool may base its data also on averages which are calculated wrt the time difference between the last poll and the current time (meaning that every second up to the next poll time may give you other data points if it needs to average out). But that may very well be total BS.
Long story short, no idea, but we're not drawing the graphs ourselves; maybe the rrdtool guys know more.
Tom
Thanks Tom, we're were just concerned that when we open out our Observium to departmental IT admins that we'll get people querying the validity of the data, so for the moment I've disabled the mouse-over graphs...
Emma
On 07/04/2014 04:03 PM, Cardinal-Richards, Emma wrote:
On 25 Jun 2014, at 20:35, Adam Armstrongadama@memetic.org mailto:adama@memetic.org wrote:
On 2014-06-24 05:25, Cardinal-Richards,Emma wrote: Hi, On (seemingly all) our device port pages I get different values in the legends on the page of graphs vs their respective hover over pop-up graphs? In theory I thought they're showing the same timeframe/data?
RRD gonna do what RRD gonna do! RRD generates the legend based on the data it hasdecided to use for the
graph. This depends on the time period and the resolution ofthe data. None of our code is involved in any of this.
Note that without a screenshot, no one knows whatyou're talking about,
and even fewer people are going to try to guess. adam.I know you were anxiously awaiting this....
I've attached a screenshot as an example, the popup graph is of the 3rd graph along. The numerical values differ, this seems to be the same on the majority of graphs not just 'traffic', and not for all values (some match).
Emma
observium mailing list observium@observium.org mailto:observium@observium.org http://postman.memetic.org/cgi-bin/mailman/listinfo/observium
Hi,
On 07/04/2014 04:30 PM, Cardinal-Richards, Emma wrote:
I -think- RRDtool may base its data also on averages which are calculated wrt the time difference between the last poll and the current time (meaning that every second up to the next poll time may give you other data points if it needs to average out). But that may very well be total BS.
Long story short, no idea, but we're not drawing the graphs ourselves; maybe the rrdtool guys know more.
Tom
Thanks Tom, we're were just concerned that when we open out our Observium to departmental IT admins that we'll get people querying the validity of the data, so for the moment I've disabled the mouse-over graphs...
Emma
I think you meant "temperamental IT admins" ... ;) In that case I'd recommend you go ask the RRDtool guys and let us know what they say! :D
Tom
On 2014-07-04 09:03, Cardinal-Richards, Emma wrote:
On 25 Jun 2014, at 20:35, Adam Armstrong adama@memetic.org wrote:
On 2014-06-24 05:25, Cardinal-Richards, Emma wrote: Hi, On (seemingly all) our device port pages I get different values in the legends on the page of graphs vs their respective hover over pop-up graphs? In theory I thought they're showing the same timeframe/data?
RRD gonna do what RRD gonna do!
RRD generates the legend based on the data it has decided to use for the
graph. This depends on the time period and the resolution of the data. None of our code is involved in any of this.
Note that without a screenshot, no one knows what you're talking about,
and even fewer people are going to try to guess.
adam.
I know you were anxiously awaiting this....
I've attached a screenshot as an example, the popup graph is of the 3rd graph along. The numerical values differ, this seems to be the same on the majority of graphs not just 'traffic', and not for all values (some match).
This is because RRD is choosing a different resolution of data for the two graphs. It doesn't need all of the data in the higher resolution dataset for the smaller graph, so it uses the more aggregated data.
The average number stays the same because the number of bits moved is the same in each resolution. The "max" (and "min", if it was visible on that graph) also stays the same, because min/max has a more restricted dataset with fewer resolutions for rrdtool to choose from.
This is an annoying, but well known, attribute of rrdtool.
Also. Do not ever use rrdtool's 95th %ile calculations for anything important. Never. Ever.
adam.
participants (4)
-
 Adam Armstrong
 -
 Cardinal-Richards, Emma
 -
Emma Cardinal-Richards
-
 Tom Laermans